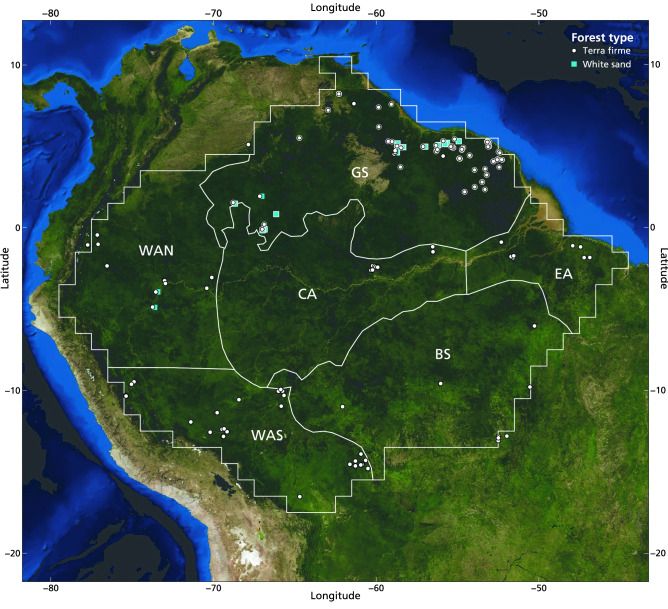
Figure 3.
Map of the 283 1-ha old-growth lowland tropical forest plots across Amazonia. The plots of the Guiana Shield dataset are marked with an additional white contour (See Supplementary Appendix S1, Figure S1.1 for the Guiana Shield dataset plots only). For each plot, the forest type is indicated by symbols, where white circle = terra firme forest, and blue square = white sand forest. Approximate borders of the six biogeographical regions of Amazonia, reproduced from ter Steege et al.32, are indicated with white lines. Abbreviations for the regions are GS = Guiana Shield, BS = Brazilian Shield, WAN = north-western Amazonia, WAS = south-western Amazonia, CA = central Amazonia, and EA = eastern Amazonia. Figure created in R43, background satellite imagery of South America by NASA44.

