Figure 1.
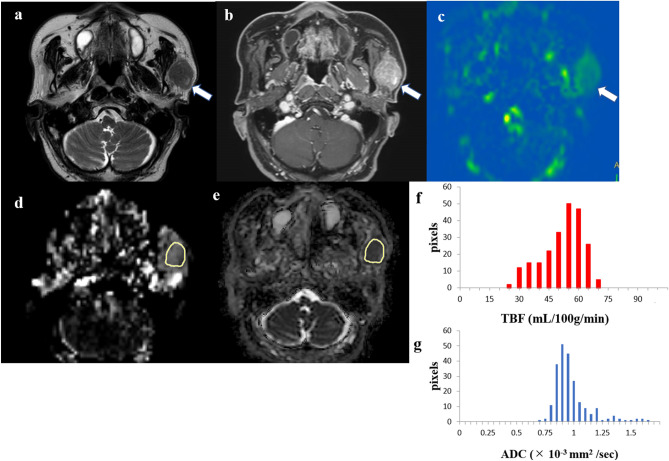
An 80-year-old male patient with a carcinoma ex pleomorphic adenoma in the left parotid gland. T2-weighted image (a) showing an iso signal intensity lesion (arrow). Contrast-enhanced 3D-T1-weighted image (b) showing homogeneous contrast enhancement (arrow). Tumor blood flow (TBF) color map (c) showing medium TBF (arrow). The region of interest (ROI) was manually drawn on the apparent diffusion coefficient (ADC) map of the software (e, yellow), and the ROI was copied from the ADC map to the TBF map of the software (d, yellow). The TBF histogram (f) and ADC histogram (g) are presented. The 50th percentile of the TBF value was 50.92 mL/100 g/min, whereas the 10th percentile of the ADC value was 0.82 × 10⁻³ mm2/s.

