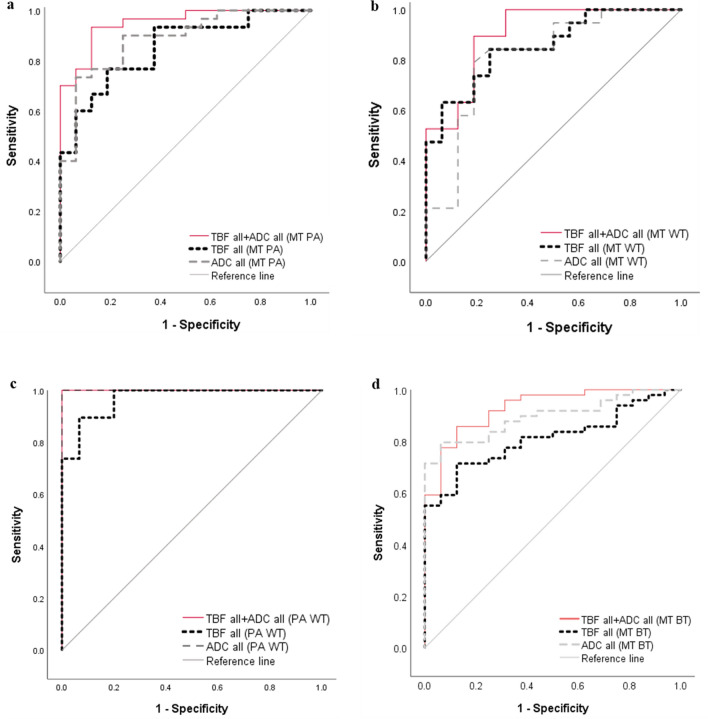
Figure 4.
ROC curve analyses for differentiating malignant tumors (MT) from pleomorphic adenomas (PA) (a), for differentiating MT from Warthin’s tumors (WT) (b), for differentiating PA from WT (c), and for differentiating MT from benign tumors (BT), including PA and WT (d). (a) The areas under the curve (AUCs) for all tumor blood flow parameters (TBFall) and all apparent diffusion coefficients (ADCall) indicate medium diagnostic performances for both (AUC = 0.850 and 0.885, respectively). Conversely, the AUC for the combination of the TBFall and ADCall indicates high diagnostic performance (AUC = 0.950). (b) The AUCs for the TBFall and ADCall indicate medium diagnostic performances for both (AUC = 0.855 and 0.814, respectively), whereas the AUC for the combination of TBFall and ADCall indicates high diagnostic performance (AUC = 0.905). (c) The AUCs of the TBFall, ADCall, and combination of TBFall and ADCall all indicate high diagnostic performances (AUC = 0.968, 1.000, and 1.000, respectively). (d) The AUCs for the TBFall and ADCall indicate medium diagnostic performances for both (AUC = 0.811 and 0.895, respectively), whereas the AUC for the combination of TBFall and ADCall indicates high diagnostic performance (AUC = 0.930).

