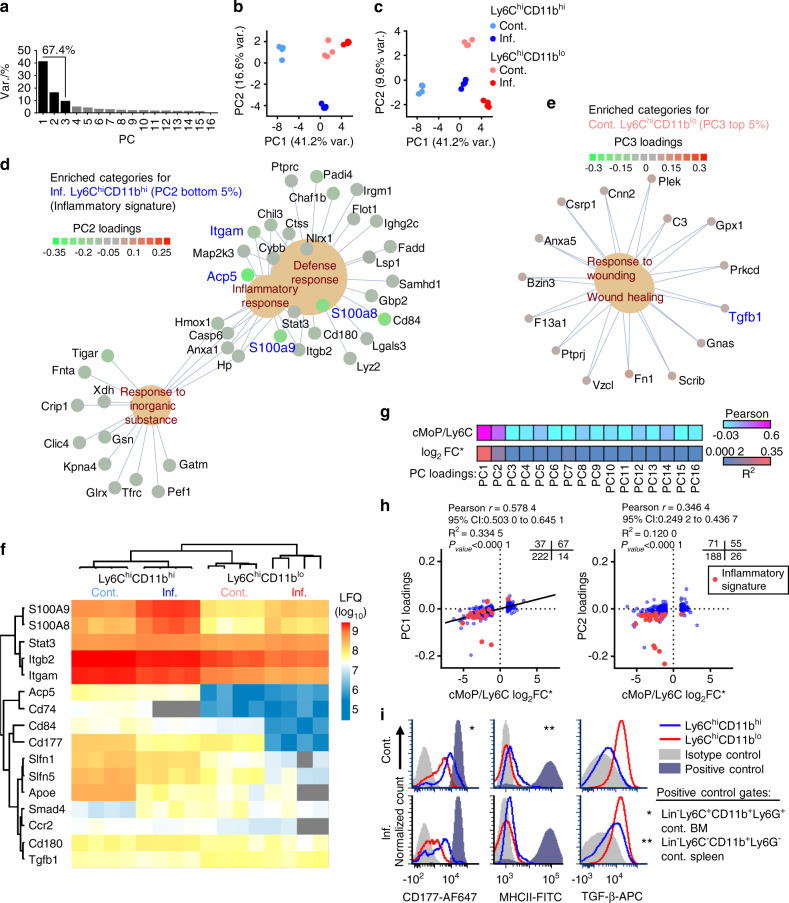
Fig. 4.
Immune-inflammatory proteomic profile is observed in Ly6ChiCD11bhi cells but not Ly6ChiCD11blo cells. a A scree plot for the PCA is presented. b Projection plot for PC1 and PC2. c Projection plot for PC1 and PC3. d Gene concept network of proteins in enriched categories in the bottom 5% of PC2 loading scores (characteristic for inflamed Ly6ChiCD11bhi cells). e Proteins in enriched categories in the top 5% of PC3 loading scores (characteristic for control Ly6ChiCD11blo cells). The Benjamini–Hochberg FDR was set to 0.05 for all GO analyses (see detailed results in Fig. S4). f Heatmap of selected key proteins residing in either the PC1 or PC2 bottom 5% or PC3 top 5% of loading scores. g Pearson coefficient and R2 heatmap of PC loadings vs. the cMoP/Ly6C signature (log2FC) reported by Hettinger et al., 201318. h Scatterplot of PC1 and PC2 loadings vs. the cMoP/Ly6C signature (log2FC) (340 proteins detected in both datasets). Quadrant counts indicated (top right). i Cell surface expression of the markers CD177, MHCII and TGF-β in control and inflamed Ly6ChiCD11bhi and Ly6ChiCD11blo cells. Positive controls are indicated by asterisks

