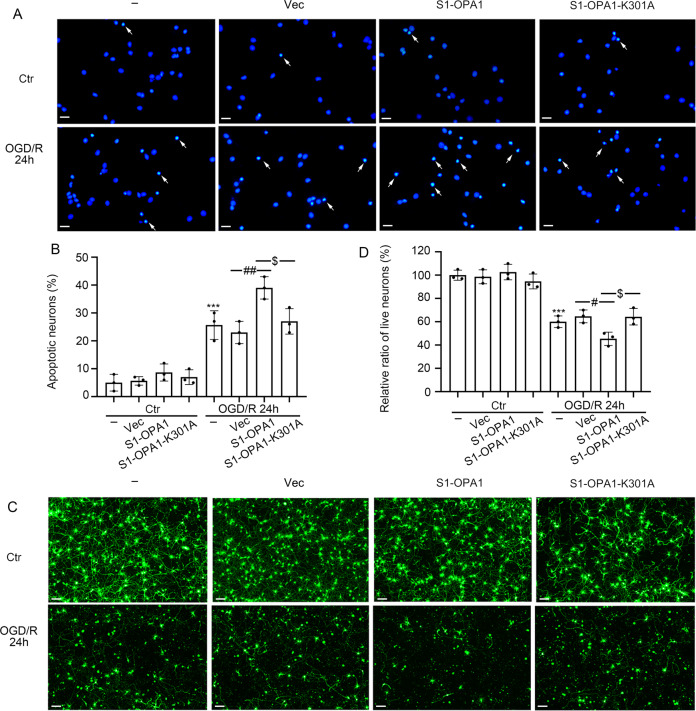
Fig. 5. S1-OPA1 overexpression led to neuronal apoptosis and death after ODG/R.
A Representative images of Hoechst staining in different overexpression groups under normal condition and OGD/R for 24 h. Arrows indicate the nuclei of apoptotic neurons. B The percentage of apoptotic neurons was statistically quantified and analyzed. C Representative images of live neurons in different overexpression groups under normal condition and OGD/R for 24 h. D Quantitative analysis of neuronal viability. ***p < 0.001 vs. control group, ##p < 0.01, #p < 0.05, $p < 0.05; scale bar = 20 μm; n = 3.

