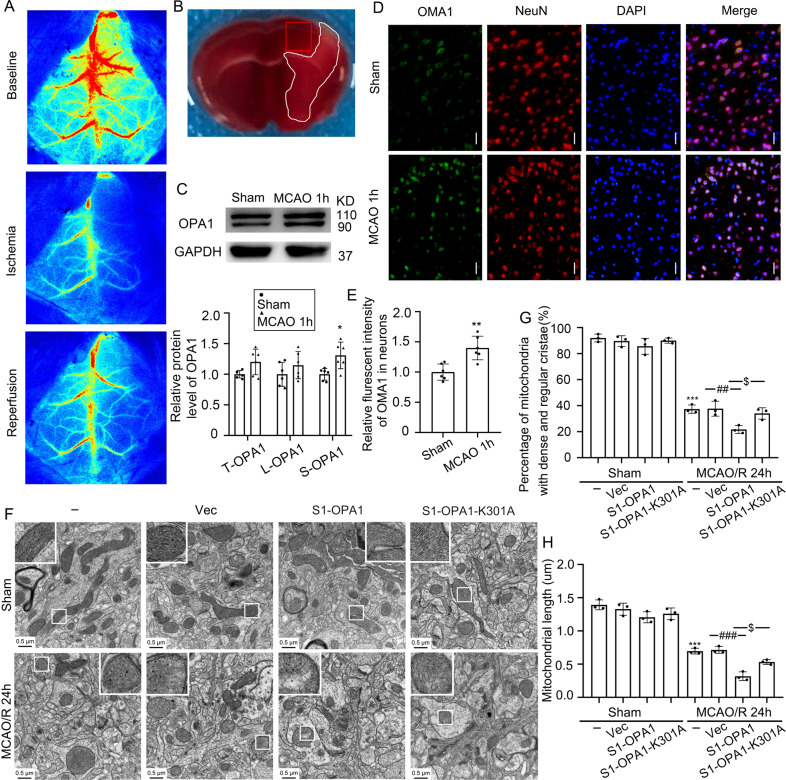
Fig. 6. S1-OPA1 was increased in the brain tissue surrounding ischemia and overexpression of S1-OPA1 aggravated mitochondrial ultrastructural damage after MCAO/R.
A Representative laser speckle images before surgery (baseline), during ischemia, and 10 min after reperfusion. B TTC staining 1 h after MCAO in mice. The infarct area is shown in white, and the area of sampling and observation is shown in the red frame. C Western blot analysis and quantification of long and short OPA1 levels in brain tissue surrounding ischemia. D Double immunofluorescence analysis was performed with anti-OMA1 (green) and neuronal marker (NeuN, red) in brain sections. Nuclei were fluorescently labeled with DAPI (blue). Scale bar = 50 μm; (E) The relative fluorescent intensities of OMA1 in neurons were statistically analyzed. **p < 0.01 vs. Sham group; *p < 0.05 vs. Sham group; n = 6. F Representative transmission electron microscopy images of mitochondria in cortical penumbra. In the sham groups, mitochondria had regular and dense cristae, as well as normal mitochondrial length. In the MCAO/R (24 h) group, the mitochondrial cristae structure was broken. The mitochondrial cristae structure became loose and disorderly, and the length of mitochondria became shorter. Scale bar = 0.5 μm; (G) Fifty mitochondria were selected from each group to assess the proportion of mitochondria with dense cristae. H Fifty mitochondria were selected from each group to calculate mitochondrial length. ***p < 0.001 vs. Sham group, ###p < 0.001, ##p < 0.01, $p < 0.05; n = 3.

