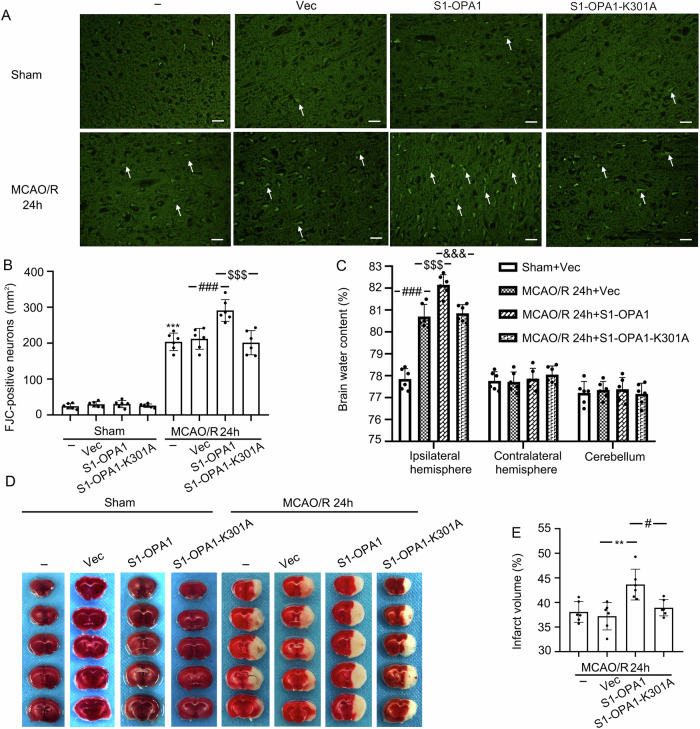
Fig. 7. Overexpression of S1-OPA1 increased neuronal degeneration and aggravated cerebral edema and cerebral infarction after MCAO/R.
A Representative images of FJC staining in sham groups and MCAO/R (24 h) groups. B FJC-positive neurons per square millimeter were counted and analyzed. C Statistical analysis of brain water content in each group after overexpression of AAVs. D Typical TTC stained-images in the sham groups and MCAO/R groups. The light white part of the brain sections indicates the infarct area. E The percentage of infarct volume was calculated and statistically analyzed. ***p < 0.001 vs. Sham group, **p < 0.01, ###p < 0.001, #p < 0.05, $$$p < 0.001, &&&p < 0.001; scale bar = 50 μm; n = 6.

