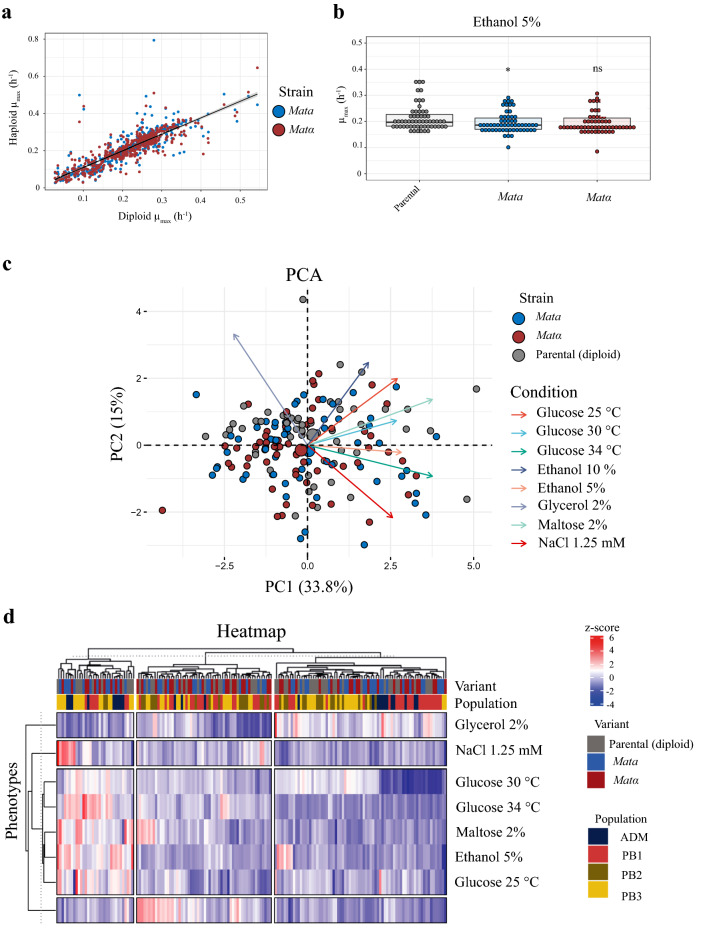
Figure 2.
Phenotypic characterization of haploid strains and their respective diploid parental strains. (a) Maximum specific growth rates of diploids and haploids comparing all strains, ploidy, and environments. Line indicates the 1:1 correlation. (b) Maximum specific growth rates for diploids and haploids for all strains under 5% ethanol. Plotted values correspond to mean value of each strain. (*) depicts different levels of significance between haploid and diploid strains (Student t-test; *p ≤ 0.05 and ns: non-significant). (c) Principal component analysis (PCA) using the maximum specific growth rates under eight growth conditions, together with the distribution of individual haploid and diploid strains. Arrows depict the different environmental conditions (d) Hierarchically clustered heatmap of phenotypic diversity within haploid and diploid parental strains. Phenotypic values are calculated as normalized z-scores.

