Figure 1.
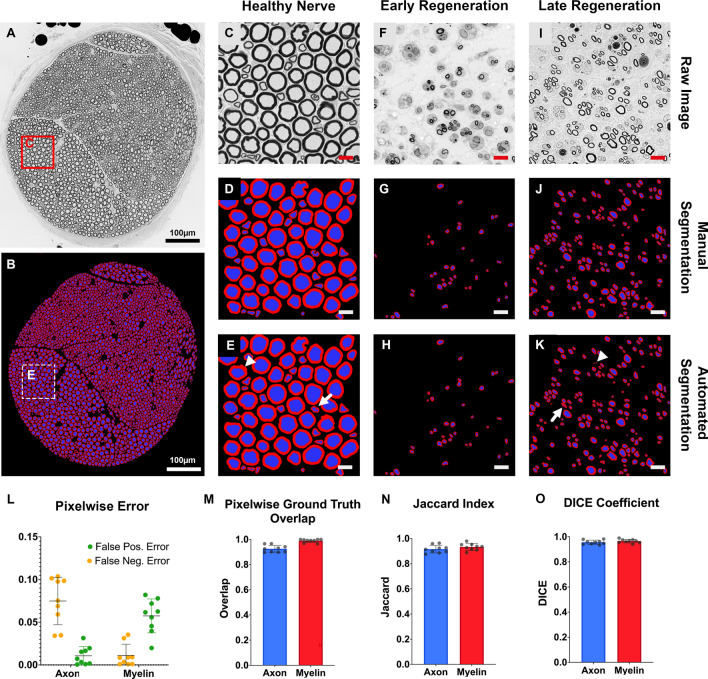
Pixelwise accuracy of automated axon/myelin segmentation. (A) Cross-section of a normal rat median nerve from the evaluation dataset. Myelinated axons are shown as black circles. Osmium tetroxide postfixed, epoxy embedded, 1 µm thickness. (B) Automated axon/myelin segmentation of the cross-section shown in A. (C) Magnified region of interest (ROI) from A. (D) Manual segmentation of myelin sheaths and axons of the ROI shown in C. (E) Automated segmentation of the ROI shown in C. Myelin sheaths are shown in red and axons are shown in blue in D and E. White arrows indicate segmentation inaccuracies due to processing artifacts of the myelin sheath (arrowhead) and irregularly shaped nerve fibers (white arrow). Scale bar represents 10 µm. (F) ROI from a rat common peroneal nerve in an early regeneration state, 3 weeks following nerve transection and epineural repair, 10 mm distal to the nerve repair site. (G) Manual and (H) automated segmentation of myelin sheaths and axons of the ROI shown in F. (I) ROI from a rat median nerve in a later regeneration state, 7 weeks following nerve transection and epineural repair, 10 mm distal to the nerve repair site. (J) Manual and (K) automated segmentation of myelin sheaths and axons of the ROI shown in I. White arrows indicate areas of over segmentation (arrowhead) and segmentation inaccuracies of singular nerve fibers with a complex shape (white arrow). (L) Pixelwise false positive and negative error for the automated axon and myelin segmentation compared to the ground truth. (M) Pixelwise overlap of the automated axon/myelin segmentations with the ground truth. (N) The Jaccard similarity index and (O) DICE coefficient indicate excellent similarity of the automated and manual axon and myelin segmentations. (own illustration created with AxonDeepSeg).

