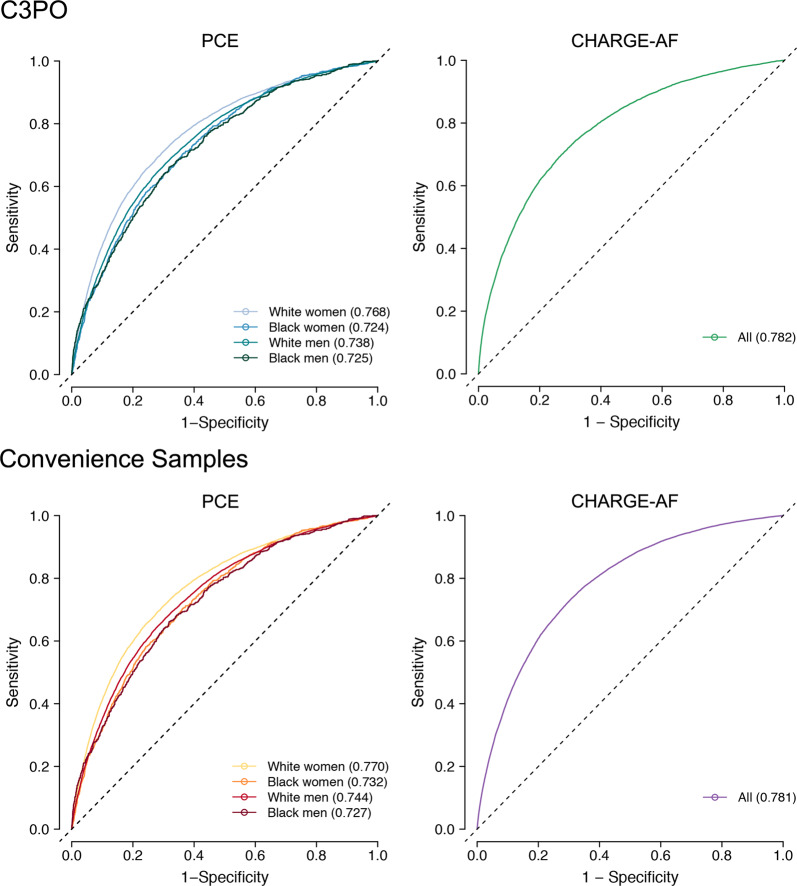
Fig. 6. Model discrimination in C3PO and Convenience Samples.
Depicted are time-dependent receiver operating characteristic curves for the Pooled Cohort Equations (PCE, left panels) and the CHARGE-AF score (right panels) in C3PO (top panels) versus the respective Convenience Samples (bottom panels). Each plot shows the discrimination performance of each risk score for its respective prediction target (i.e., 10-year MI/stroke for the PCE, 5-year incident AF for CHARGE-AF). Since the PCE score comprises four models stratified on the basis of sex and race, the curves for each score are represented separately (see legend). The c-index calculated using the inverse probability of censoring weighting method28 is depicted for each model.

