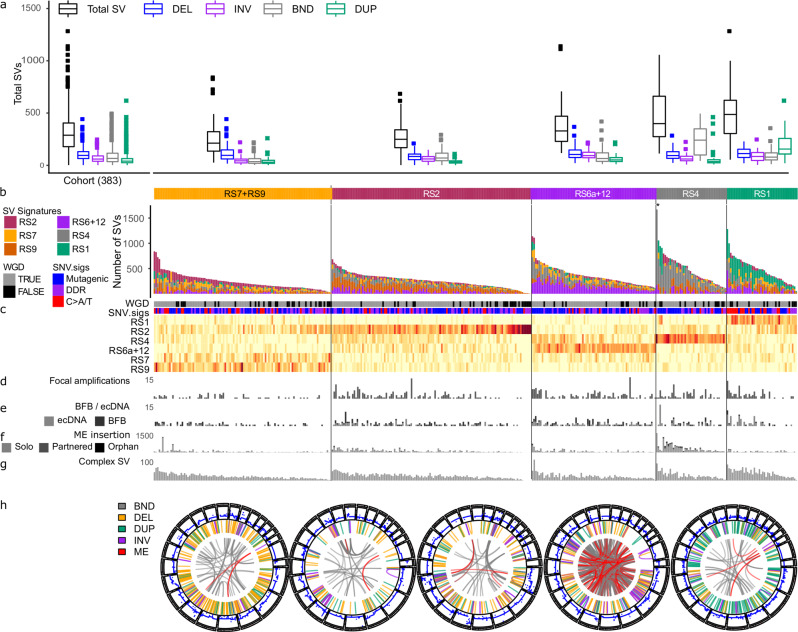
Fig. 1. Classification of OACs according to the proportions of SV types and signatures.
Tumours are shown classified into groups according to their predominant SV signature defined by Nik-Zainal et al. (2016). a Box plot showing numbers of SVs by SV type for the entire cohort and in each group (named after the simplest rearrangement that could generate such a junction, DEL: deletion, INV: inversion, BND: ‘breakend’, i.e. an inter-chromosome junction or translocation, DUP: tandem duplication). b Bar plots of rearrangements associated to each rearrangement signatures in OAC. c Heatmap showing proportions of SVs associated to each signature and a comparison with related variables: whole genome doubling (WGD), SNV signature classification (Mutagenic, DDR and C > A/T) described by Secrier (2016), d focal amplifications, e number of BFB and ecDNA cycles, f number of mobile element insertions and g complex SV clusters. h Circos plots of representative tumours from each signature group with ME insertions highlighted in red. *Denotes tumour with >2500 SVs excluded from plot.

