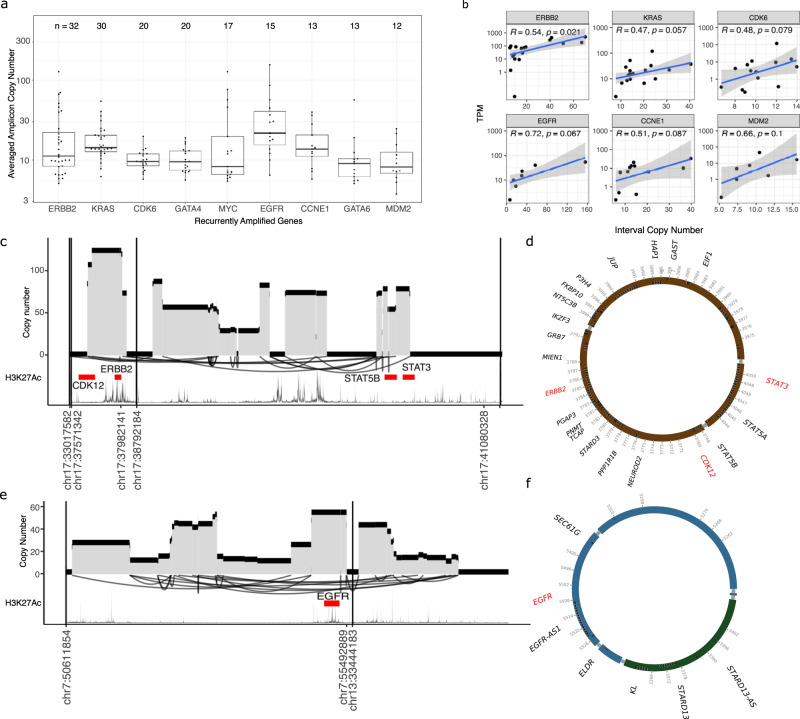
Fig. 2. Complex SVs leading to amplification of oncogenes.
a Recurrent amplicons detected by Amplicon Architect associated with known OAC oncogenes. The number of tumours with detected amplicon is shown above. Y-axis showing copy number of segments spanning each gene, averaged along the length of segment. b Correlation of gene expression (TPM) and copy number of amplicons. c Example of an amplified region spanning CDK12, ERBB2, STAT3 and STAT5B, resembling ecDNA and d Reconstructed amplicon as an extrachromosomal circle containing ERBB2 and a CDK12-STAT5B fusion. e An amplified region spanning EGFR and joining chromosomes 7 and 13, forming an ecDNA and reconstructed as a circle (f).

