Figure 4.
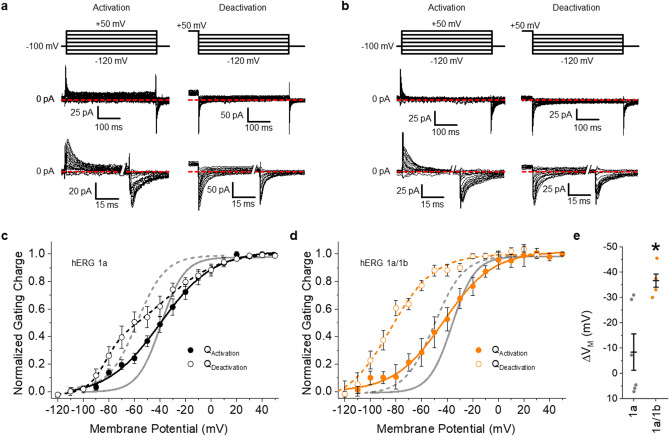
hERG 1b expression transforms hERG channel gating charge. (a) Activation and deactivation pulse protocols (top) and corresponding activation and deactivation gating current traces recorded at 36 ± 1 °C from HEK293 cells stably expressing hERG 1a. An expanded view of the gating current traces is show at bottom. (b) Activation and deactivation pulse protocols (top) and corresponding activation and deactivation gating current traces recorded at 36 ± 1 °C from HEK293 cells stably expressing hERG 1a and hERG 1b. An expanded view of the gating current traces is show at bottom. (c) Voltage dependence of hERG 1a gating charge activation (filled circles) and deactivation (open circles). Gating currents elicited during the test pulse were integrated, and the resultant gating charge was normalized, plotted as a function of test potential and fitted with a Boltzmann function. Voltage dependence of ionic current activation and deactivation are shown in gray. (d) Voltage dependence of hERG 1a/1b gating charge activation (filled circles) and deactivation (open circles). Voltage dependence of ionic current activation and deactivation are shown in gray. Expression of hERG 1b with hERG 1a triggered disparate shifts in the voltage dependence of VSD and ionic deactivation. (e) The magnitude of hysteresis was quantified by subtracting the Vmedian of deactivation from the Vmedian of activation. Hysteresis was significantly larger when hERG 1b was coexpressed with hERG 1a (n = 10) compared with hERG 1a expressed alone (n = 8). All data are reported as mean ± SEM. * indicates p < 0.05.

