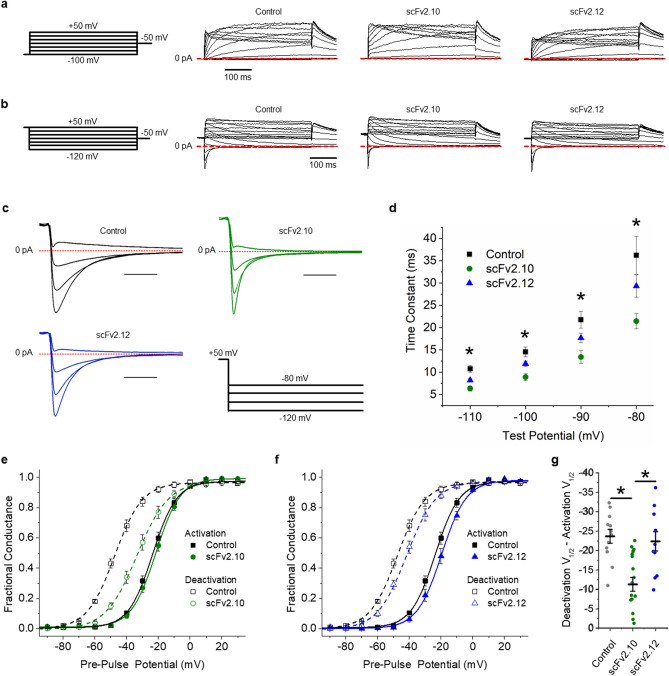
Figure 5.
Effects of anti-PAS antibodies on hERG 1a ionic current hysteresis. (a) Pulse protocol (left) and corresponding sample ionic traces showing hERG 1a activation in vehicle control solution or in the presence of 10 µM scFv2.10 or 10 µM scFv2.12. (b) Pulse protocol (left) and corresponding sample ionic traces showing hERG 1a deactivation in vehicle control solution or in the presence of scFv2.10 or scFv2.12. (c) scFv2.10 modification of hERG 1a voltage dependence. Normalized peak tail current, representing fractional conductance, is plotted as a function of pre-pulse potential and fitted with a Boltzmann function for hERG 1a recordings in vehicle control solution (black) and scFv2.10 (green). (d) scFv2.12 modification of hERG 1a voltage dependence. Normalized peak tail current, representing fractional conductance, is plotted as a function of pre-pulse potential and fitted with a Boltzmann function for hERG 1a recordings in vehicle control solution (black) and scFv2.12 (blue). (e) The magnitude of hysteresis was quantified by subtracting the V1/2 of deactivation from the V1/2 of activation. Hysteresis was significantly smaller in the presence of scFv2.10 (n = 14) compared with control recordings (n = 12) and recordings in the presence of scFv2.12 (n = 6). (f) Expanded view of deactivating hERG 1a ionic currents recorded from Control (black), scFv2.10 (green) and scFv2.12 (blue) cells. (g) Fast time constants of deactivation plotted as a function of test potential for Control (black), scFv2.10 (green) and scFv2.12 (blue) cells. Time constants were derived by fitting current decay with a double exponential function. All data are reported as mean ± SEM. * indicates p < 0.05.

