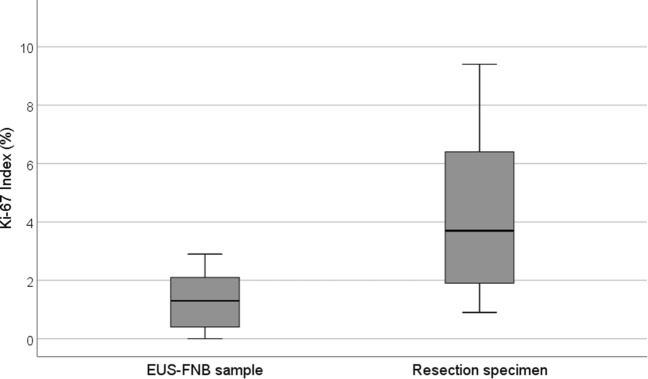
Figure 2.
A box-plot of study cases subjected to surgical resection (n = 17) showing the estimated Ki-67 Index calculated in the EUS-FNB samples and the reference Ki-67 Index calculated in the corresponding resection specimens. The bold line signifies the median, the box signifies the IQR, and the T-bars signify the 95% confidence interval. The five resected cases without a corresponding, diagnostic EUS-FNB sample available for Ki-67-indexing were excluded from the plot.

