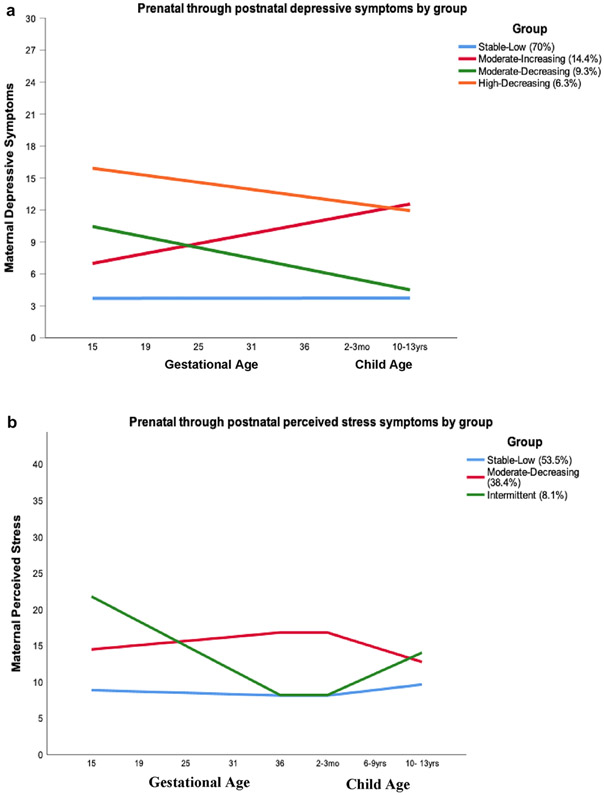
Figure 1.
a Latent trajectory groups of depressive symptoms in the prenatal through postpartum period (N = 270)
b Latent trajectory groups of perceived stress in the prenatal through postpartum period (N = 271)
Note. The largest group (n = 189, 70.0%) consisted of women who reported stable and low levels of depressive symptoms through pregnancy and postpartum (Stable-Low Group). The second largest trajectory pattern comprised women who started pregnancy with a low level of depressive symptoms that increased steadily through gestation and continued into the postpartum period (Moderate-Increasing Group; n = 39, 14.4%). Women who reported elevated depressive symptoms early in pregnancy with levels decreasing through gestation and into the postpartum period were clustered in the Moderate-Decreasing Group (n = 25, 9.3%). The fourth profile was characterized by relatively higher, but stable levels of symptoms across the pregnancy through postpartum time period (High-Decreasing Group) (n = 17, 6.3%). The group depressive symptom means at each time point are as follows: T1 (15 weeks’ gestation) M = 0.70, SD = 0.58; T2 (19 weeks’ gestation) M = 0.70, SD = 0.57; T3 (25 weeks’ gestation) M = 0.73, SD = 0.57; T4 (31 weeks’ gestation) M = 0.80, SD = 0.61; T5 (36 weeks’ gestation) M = 0.84, SD = 0.57; T6 (3 months postpartum) M = 0.59, SD = 0.55; T7 (child age 10-13) M = 0.56, SD = 0.51.
Note. Most women (n = 145, 53.5%) reported the pattern of stable and low levels of perceived stress from pregnancy through postpartum (Stable-Low Group). Women who reported moderate levels of perceived stress throughout the prenatal through postpartum period made up the second largest group (n = 104, 38.4%) (Moderate-Decreasing Group). The third and smallest group (n = 22, 8.1%) consisted of women with a more dynamic profile characterized by a decrease across gestation and an increase across the postnatal period (Intermittent Group). The group perceived stress means at each time point are as follows: T1 (15 weeks’ gestation) M = 1.30, SD = 0.65; T2 (19 weeks’ gestation) M = 1.27, SD = 0.66; T3 (25 weeks’ gestation) M = 1.20, SD = 0.72; T4 (31 weeks’ gestation) M = 1.26, SD = 0.73; T5 (36 weeks’ gestation) M = 1.27, SD = 0.69; T6 (3 months postpartum) M = 1.17, SD = 0.66; T7 (child age 6-9) M = 1.15, SD = 0.65; T8 (child age 10-13) M = 1.15, SD = 0.57.

