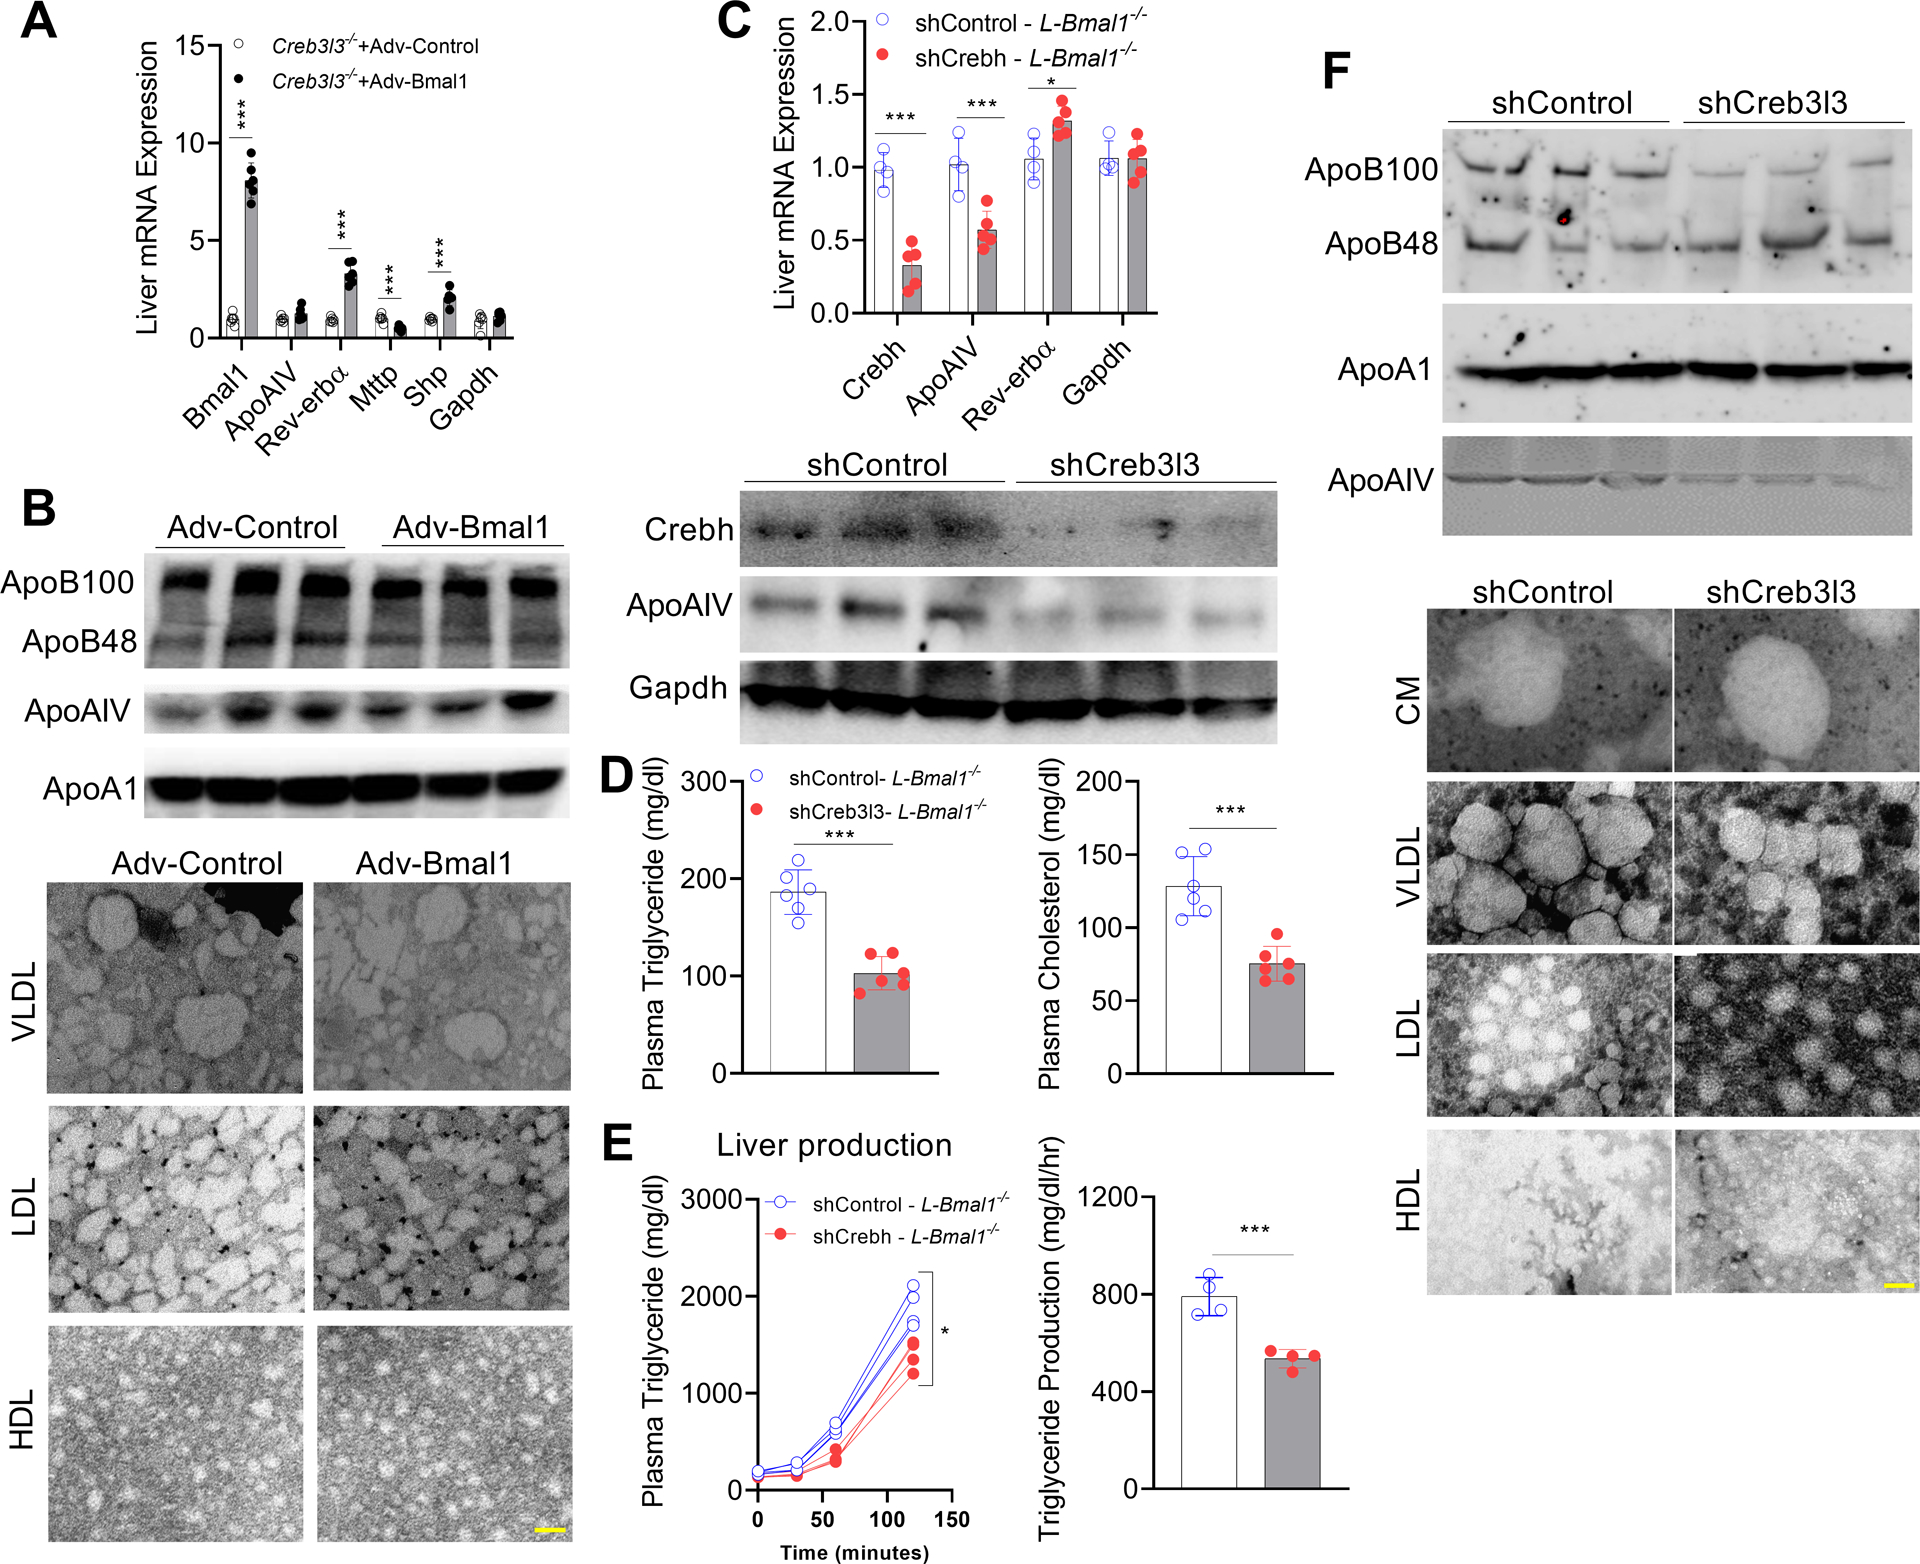
Figure 5: Overexpression of Bmal1 in the livers of Creb3l3−/− mice and knockdown of Crebh in L-Bmal1−/− mice have no effect on ApoAIV expression.

(A-B) Male Creb3l3−/− mice were intravenously injected with adenoviruses expressing GFP or Bmal1 (1.5 × 10¹¹ GC/mouse). After 4 weeks, livers and intestines were used to measure mRNA levels. Mean ± SD. N=5–6, *** p<0.001, t-test. (B) Top, plasma was used to measure apolipoproteins by western blotting. Bottom, isolated lipoproteins were studied by electron microscopy. Scale bar = 50 nm.
(C-F) L-Bmal1−/− (16-weeks-old, male) mice were transduced intravenously with AAV-shCrebh3l3 (2.5 × 10¹¹ GC/mouse). After 3 months, plasma and tissues were collected. (C) Livers were used to measure mRNA (top), and protein (bottom) levels. (D) Plasma was used to measure lipid levels. Values are represented as mean ± SD. * p<0.05, and *** p<0.001, t-test. (E) Mice were injected with P407 to measure plasma triglyceride levels (left) and triglyceride production rates (right). (F) Plasma collected at 12:00 was used to measure apolipoproteins (top) and to isolate lipoproteins for negative staining (bottom). Scale bar = 50 nm.
