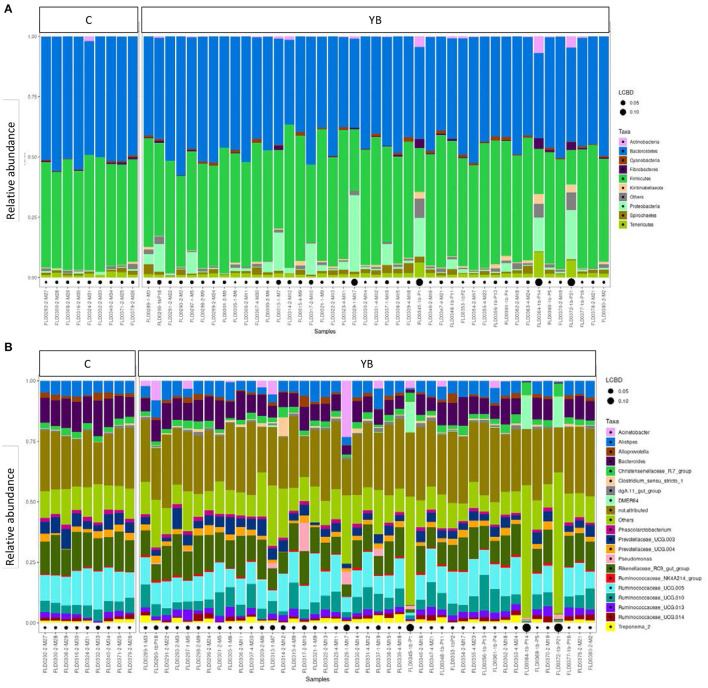
Figure 2.
Taxonomic profiles of the fecal bacteria from dairy cows (C) and young bulls (YB). (A) Bar plot representation of relative proportion of the nine major phyla in the fecal samples. (B) Bar plot representation of relative proportion of the 20 major genera in the fecal samples. Black points size is proportional to the local contribution to beta diversity for each sample.

