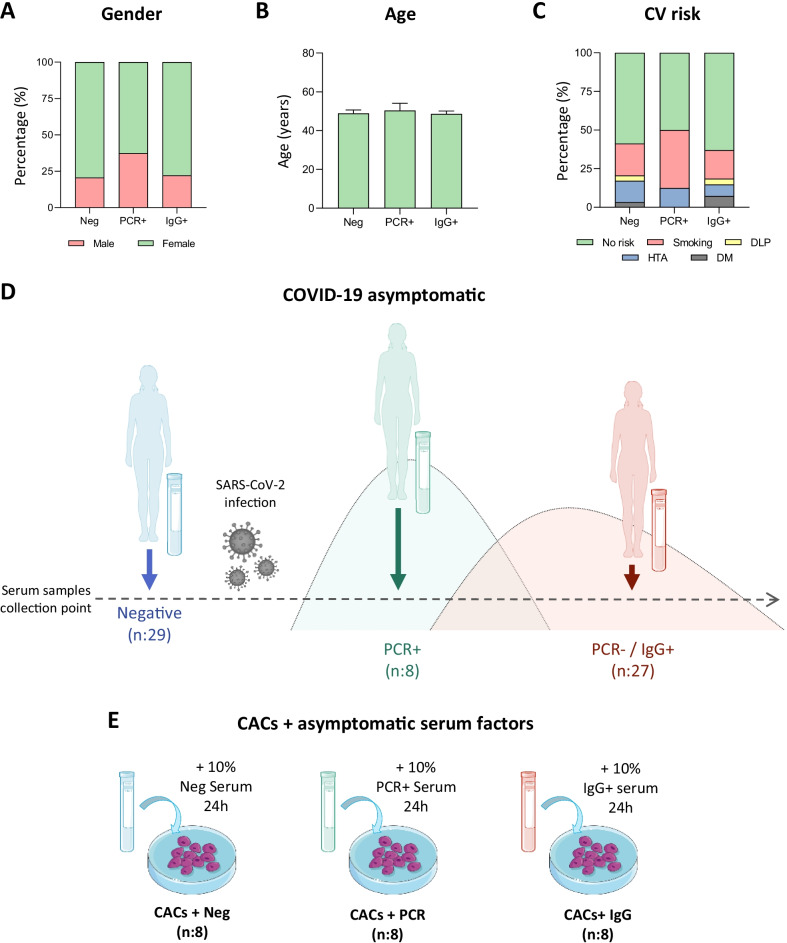
Fig. 1.
Study population characteristics and schematic representation of the experimental assay. A graphical representation of the donors’ characteristics is shown, including A Gender, B age and C Cardiovascular (CV) risks reported for each group. D Schematic representation of the infective stage of asymptomatic individuals at the time of serum extraction. Individuals were classified as COVID-19 negative (PCR −/IgG −, n:29), or COVID-19 positive, at the peak of infection (PCR + /IgG −, n:8) or after the infective peak (PCR −/IgG +, n:27). E CACs were incubated with the serum of COVID-19 negative donors, or with the serum of COVID-19 PCR + or COVID-19-IgG + asymptomatic patients

