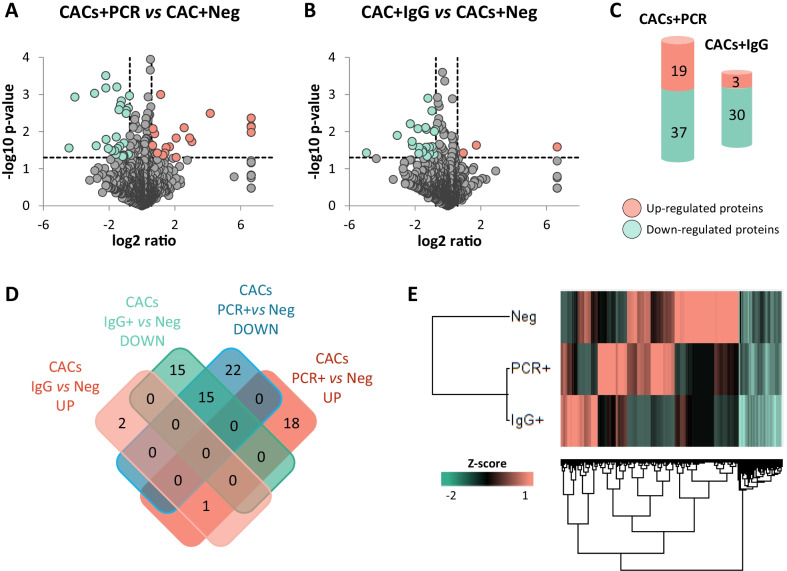
Fig. 3.
Proteomic changes in CACs in response to the serum of COVID-19 asymptomatic patients. Volcano plots representing proteins up- (red) or down- (green) regulated between CACs treated with A the serum of COVID-19 PCR + vs Negative donors (CACs + PCR), or B the serum of IgG + (CACs + IgG) vs COVID-19 negative donors (CACs + Neg). C Schematic representation of the number of proteins up- (red) or down- regulated (green) in CACs + PCR or CACs + IgG compared to CACs + Neg controls. D Venn’s diagram including the number of proteins up- or down-regulated, common or exclusive in CACs + PCR vs CACs + Neg, or in CACs + IgG vs CAC + Neg. E Hierarchical cluster representing the differential protein profiles for CACs + PCR, CACs + IgG or CACs + Neg

