
Fig. 3.
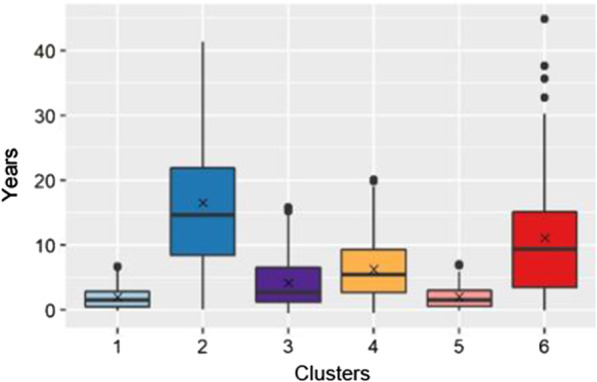
Comparison of duration of disease in years among clusters. For each cluster, median and IQR are shown by boxplots and means are shown by x in the center of boxplots. Potential outliers are indicated by distinct points
Official websites use .gov
A
.gov website belongs to an official
government organization in the United States.
Secure .gov websites use HTTPS
A lock (
) or https:// means you've safely
connected to the .gov website. Share sensitive
information only on official, secure websites.
Comparison of duration of disease in years among clusters. For each cluster, median and IQR are shown by boxplots and means are shown by x in the center of boxplots. Potential outliers are indicated by distinct points