Figure 1.
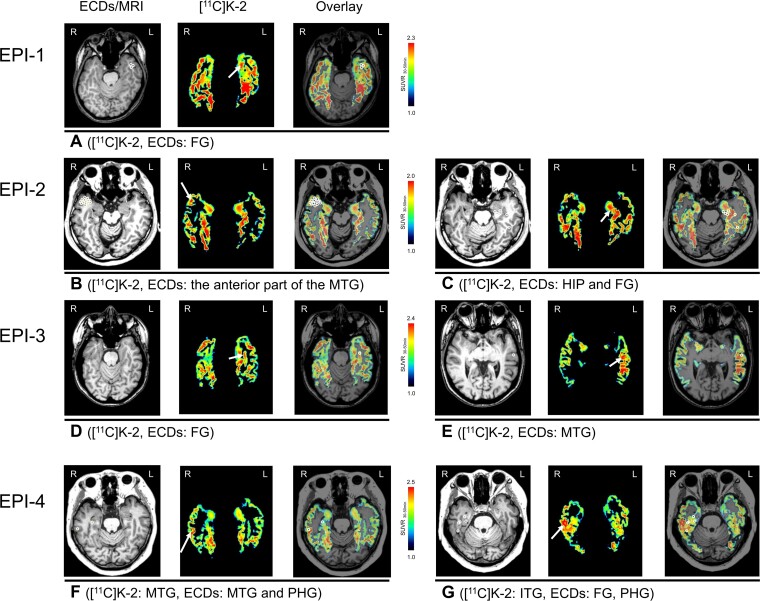
Increased [11C]K-2 signals colocalize with ECDs in SUVR30–50 min images of temporal lobes in patients with MTLE. Representative [11C]K-2 SUVR30–50 min images are shown restricted to temporal lobes where ECDs are estimated. Each panel shows ECDs on MRI (left), [11C]K-2 (middle) and overlay (right). White arrows indicate the area showing elevated [11C]K-2 uptakes and white circles indicate estimated ECDs. (A) EPI-1 showed elevated [11C]K-2 uptake and estimated ECDs in the left FG. EPI-2 showed elevated [11C]K-2 uptake and estimated ECDs in the anterior part of the right MTG (B) and, further, elevated [11C]K-2 uptake and estimated ECDs were identified in the left HIP and the anterior part of FG. One ECD (posterior white circle) was estimated in the posterior part of FG (C). EPI-3 showed elevated [11C]K-2 uptake (white arrow) and estimated ECD (white circle) in the left FG (D) and, further, elevated [11C]K-2 uptake and estimated ECDs were identified in left MTG (E). EPI-4 showed elevated [11C]K-2 uptake (white arrow) and estimated ECD (outer white circle) in MTG and the other ECD was estimated in the parahippocampal gyrus (PHG, inner white circle) (F). Furthermore, elevated [11C]K-2 uptake was identified in the right ITG and estimated ECDs were identified in FG, adjacent closely to ITG, PHG (G).

