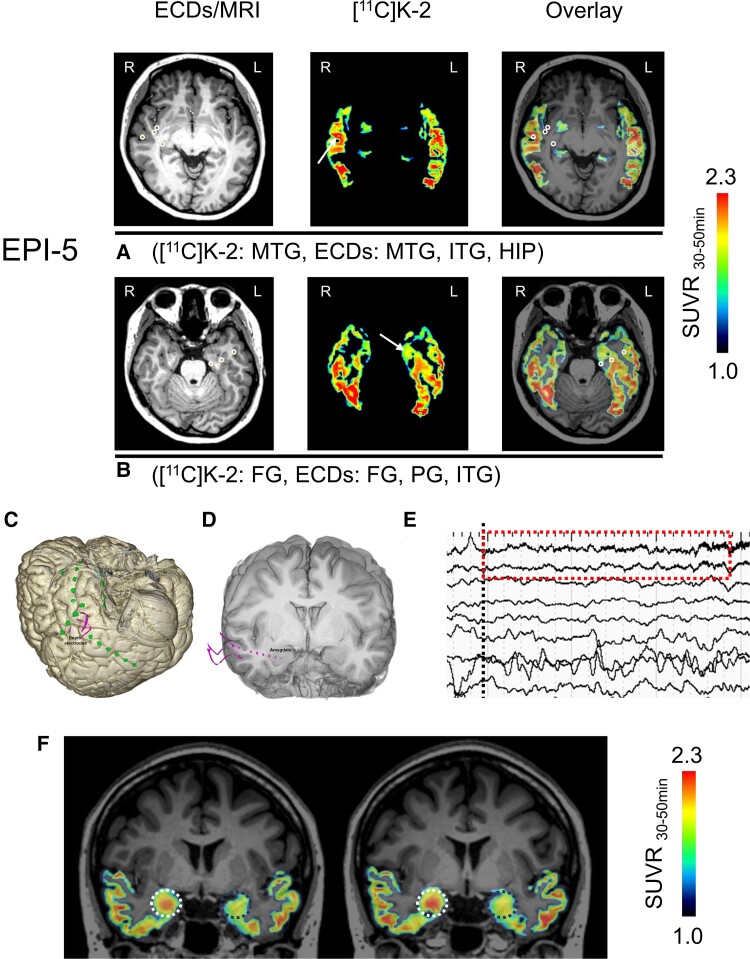
Figure 2.
[11C]K-2 is highly taken up in the SOZ. (A and B) Representative [11C]K-2 SUVR30–50 min images are shown, restricted to temporal lobes where ECDs are estimated. Each panel shows ECDs on MRI (left), [11C]K-2 (middle) and overlay (right). White arrows indicate the area showing elevated [11C]K-2 uptakes and white circles indicate estimated ECDs. EPI-5 showed elevated [11C]K-2 uptake and estimated ECDs in the right MTG and, further, other ECDs were estimated in right ITG and HIP (A). Furthermore, elevated [11C]K-2 uptake and estimated ECDs were identified in the left FG, and other ECDs were estimated in left PG and ITG (B). (C) The area where subdural electrodes are implanted in EPI-5. Pink lines show depth electrodes and green dots show brain surface electrodes. (D) Three depth electrodes were implanted targeting to right amygdala (pink lines and dots). (E) The iEEG change at the seizure onset (ictal EEG onset) is shown with black dots line. The earliest iEEG change (low-voltage fast activity indicated by red-dashed square) was detected by the depth electrode in right amygdala alone. The activity was the first unequivocal change at the ictal onset phase. Therefore, we deemed that the amygdala was the SOZ in this patient. (F) The zoomed image of red-dashed square in Fig. 2E shows that low-voltage fast activity occurs in the right amygdala. (G) SUVR30–50 min images show that the elevated [11C]K-2 uptake colocalizes with the SOZ (right amygdala: white dots circle). The contralateral amygdala is indicated as a dotted blue circle.

