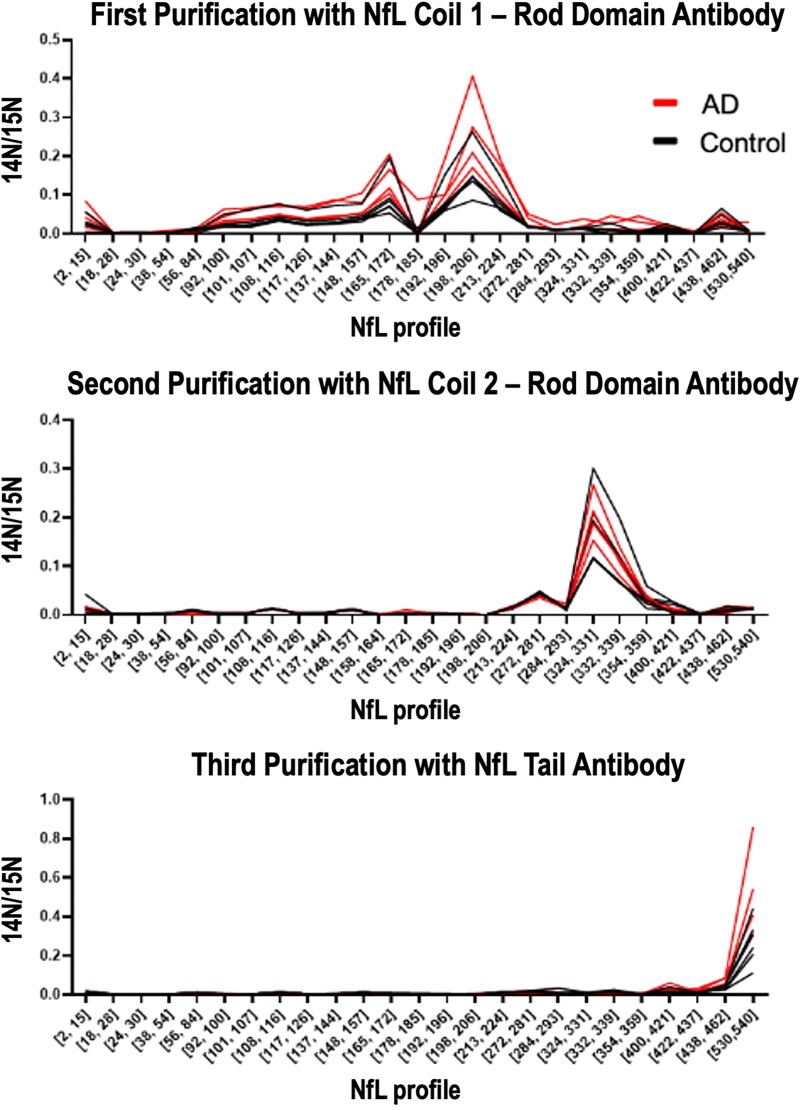
Figure 3.
NfL species are increased in Alzheimer’s disease CSF compared with healthy controls. Sequential IP-MS of the three main CSF NfL species identifies increased NfL levels in Alzheimer’s disease dementia (n = 4) compared with controls (n = 6) for each main species. Red lines represent relative amounts of NfL species for individuals with Alzheimer’s disease dementia as determined by the presence of amyloid plaques by PET and very mild dementia (CDR = 0.5) and black lines represent healthy age-matched controls (CDR = 0).

