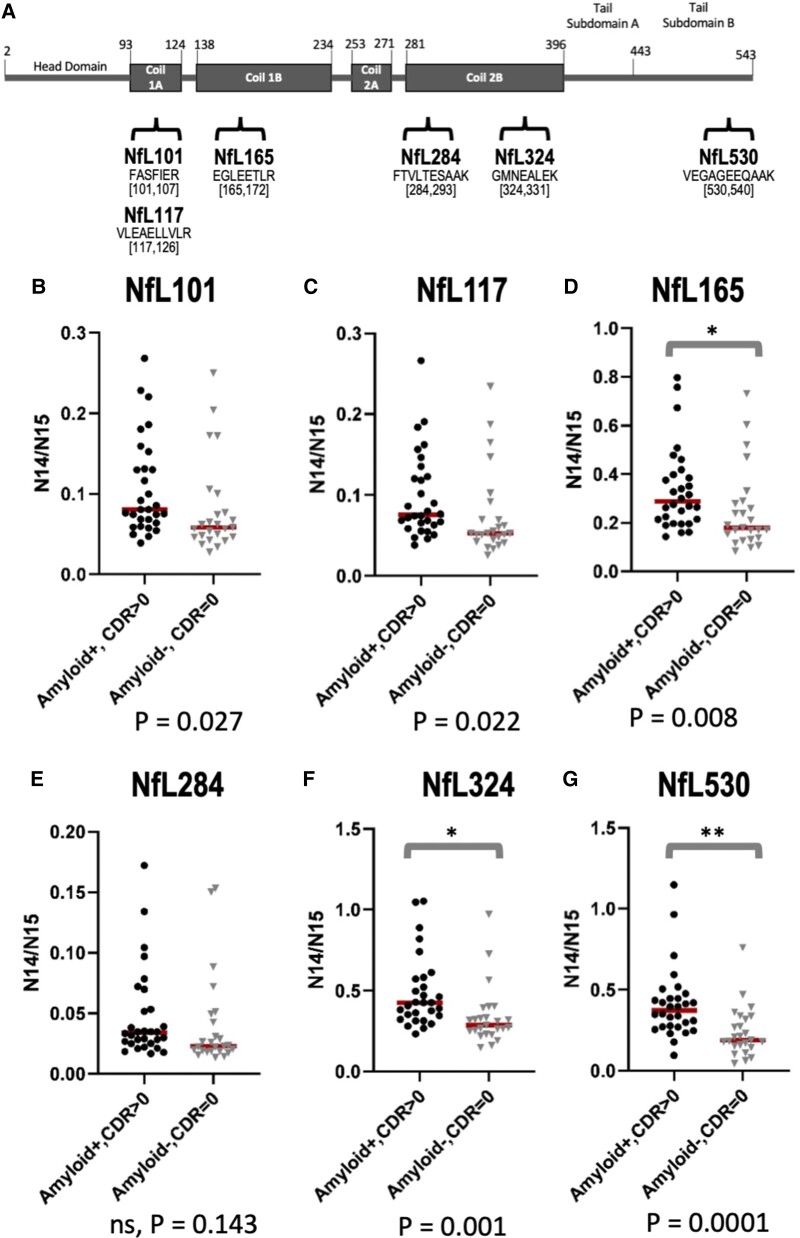
Figure 4.
Validation cohort confirms increased NfL324 and NfL530 in Alzheimer’s disease compared with healthy controls. Schematic showing NfL map and location of peptides in quantitative IP-MS method (A). Comparison of NfL peptides between symptomatic Alzheimer’s disease participants (n = 30; amyloid-positive, CDR > 0) and healthy controls (n = 25; amyloid-negative, CDR = 0) for Coil 1A and 1B regions NfL101 (B), NfL117 (C) and NfL165 (D) show non-significant increased trends in Alzheimer’s disease, no difference in Coil 2B NfL284 region (E) and highly significant increases in NfL324 (F), and C-terminal region NfL530 (G). Data are right skewed and as such, t-tests were performed on log-transformed data. To accurately depict the absolute differences between groups, the y-axes were not log-transformed. *Statistical significance at P < 0.01; **Statistical significance at P < 0.001.

