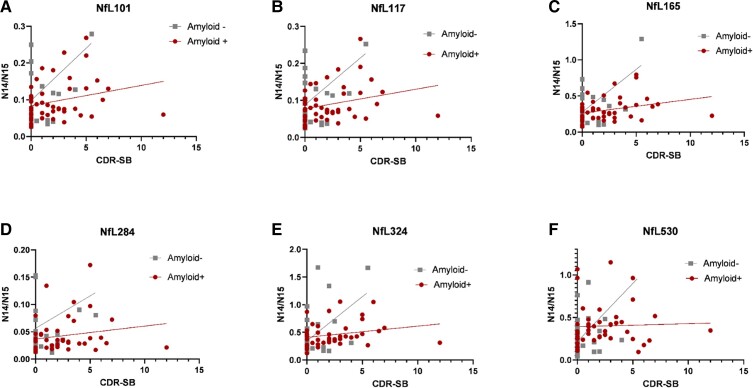
Figure 6.
NfL species correlation with Alzheimer’s disease dementia stage (CDR-SB). The amount of NfL species are minimally correlated with the stage of dementia severity. The x-axis of each graph denotes the CDR-SB, a clinical scale of dementia with CDR-SB 0 is normal, CDR-SB 0.5–6 indicates mild dementia and CDR-SB >6 indicates moderate clinical dementia. The relative amount of NfL species is shown in the y-axis as the N14/N15 ratio of the NfL region. Spearman’s correlation and P-value were calculated for each group—NfL101: Amyloid+ Spearman r = 0.29 (ns, P = 0.05), Amyloid– Spearman r = 0.18 (ns, P = 0.30) (A); NfL117: Amyloid+ Spearman r = 0.30 (P = 0.04), Amyloid– Spearman r = 0.18 (ns, P = 0.31) (B); NfL165: Amyloid+ Spearman r = 0.36 (P = 0.01), Amyloid– Spearman r = 0.19 (ns, P = 0.28) (C); NfL284: Amyloid+ Spearman r = 0.24 (ns, P = 0.10), Amyloid– Spearman r = 0.31 (ns, P = 0.07) (D); NfL324: Amyloid+ Spearman r = 0.30 (P = 0.04), Amyloid– Spearman r = 0.16 (ns, P = 0.35) (E); NfL530: Amyloid+ Spearman r = 0.13 (ns, P = 0.39), Amyloid– Spearman r = 0.25 (ns, P = 0.14) (F). Participants with amyloid plaques are shown with red circles, and amyloid-negative participants are shown with grey squares. NfL101, NfL117, NfL165 and NfL284 each have one outlier not plotted on the graph but included in calculations of correlation.

