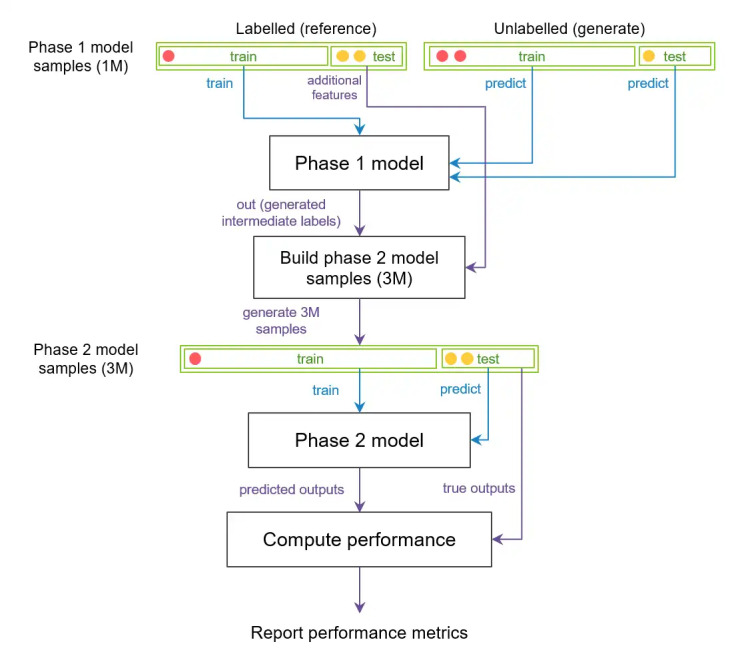
Figure 3.

Schematic representation of the PSYCHE-D (Prediction of Severity Change-Depression) combined pipeline architecture, used to estimate performance on previously unseen participants. The phase 1c model is trained on a subset of participants in the training set, and predictions for the training and test set participants are made. The phase 2c model has the same participant split for the training and test sets. Red and yellow circles represent samples from 2 different participants. All samples from the red participant are in the training set, and all samples from the yellow participant are in the test set for both phases 1c and 2c. Green blocks represent data, and black blocks represent models and data processing stages. Blue arrows represent input to classification models for training or predicting, and purple arrows represent data passage for other purposes (eg, providing true output values for testing). Note: multiple circles represent multiple samples from the same participant. This procedure is repeated over 5 random participant-based splits of the training and test data, to obtain confidence intervals for the combined pipeline performance.
