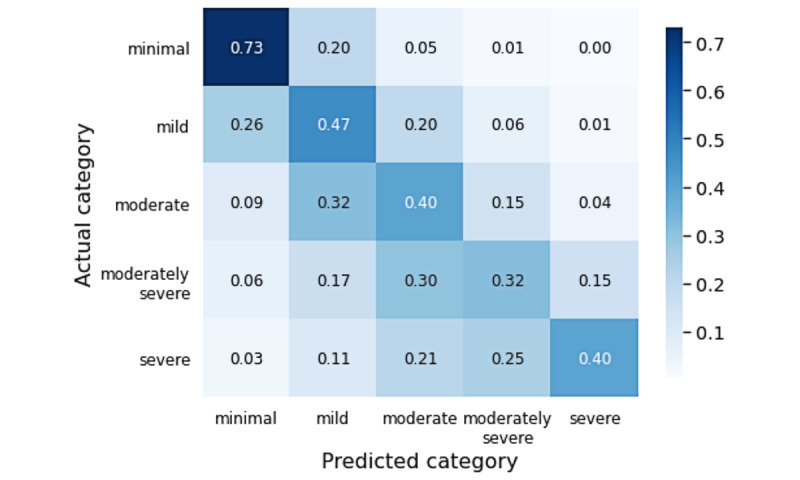
Figure 4.

Confusion matrix showing the phase 1c model’s Patient Health Questionnaire-9 (PHQ-9) score category accuracy distribution across PHQ-9 severity groups. Darker blue represents higher accuracy. Performance overall is weak, but adjacent accuracy is high, and classification performance in samples from individuals with lower (minimal to mild) and higher (moderately severe to severe) severity is relatively high, compared to the performance seen for intermediate severity samples.
