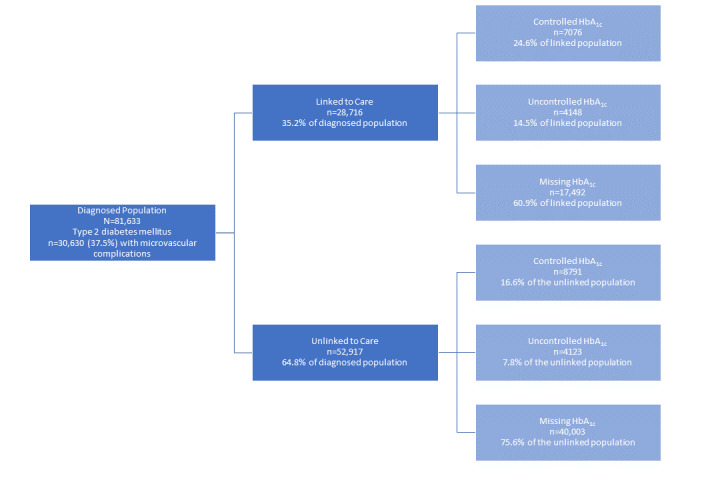
Figure 1.

This flowchart illustrates the cascade of type 2 diabetes care with cohort sizes at each stage of the cascade, including information about missing glycemic data. Note, the control row of the flowchart indicates the percentage of the linked or unlinked cohorts, not the percentage of the original diagnosed cohort. HbA1c: hemoglobin A1c.
