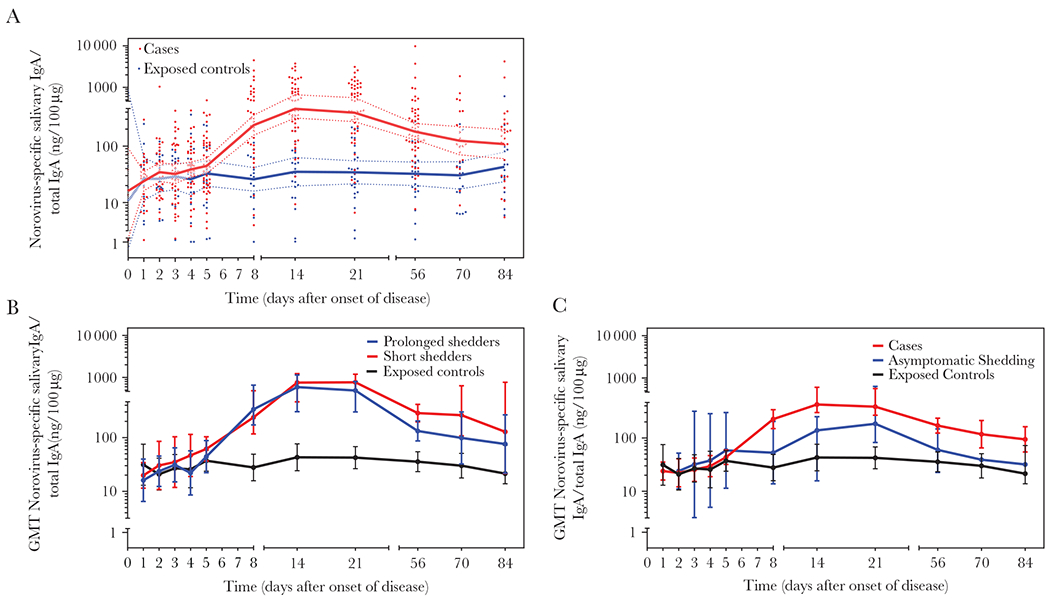
Figure 2.

Norovirus-specific salivary IgA antibody levels during outbreaks. A, Norovirus GI.1 and GII.4 variant-specific salivary IgA antibody levels for each time point for 62 cases (red circles; n = 441) and 34 exposed controls (blue circles; n = 208) are shown. Geometrical mean values for salivary IgA antibodies for cases and exposed controls over the course of the study are depicted as red or blue lines with 95% Confidence interval (shadow), respectively. B, Norovirus-specific salivary IgA antibody levels for each time point are presented for participants with norovirus positive acute stool sample (n = 15; red circles; short shedders), with norovirus positive acute and convalescent stool sample (n = 14, blue circles; long shedders), and 35 exposed controls (black circles). C, Norovirus-specific salivary IgA antibody levels for each time point for 33 cases (red circles), 35 exposed controls (black circles), and 3 asymptomatic shedders (blue circles) are shown. Saliva samples were tested using VLPs based on the norovirus strain detected in the outbreak. Abbreviations: GMT, geometric mean titer; IgA, immunoglobulin A; VLPs, virus-like particles. See online version for color figure.
