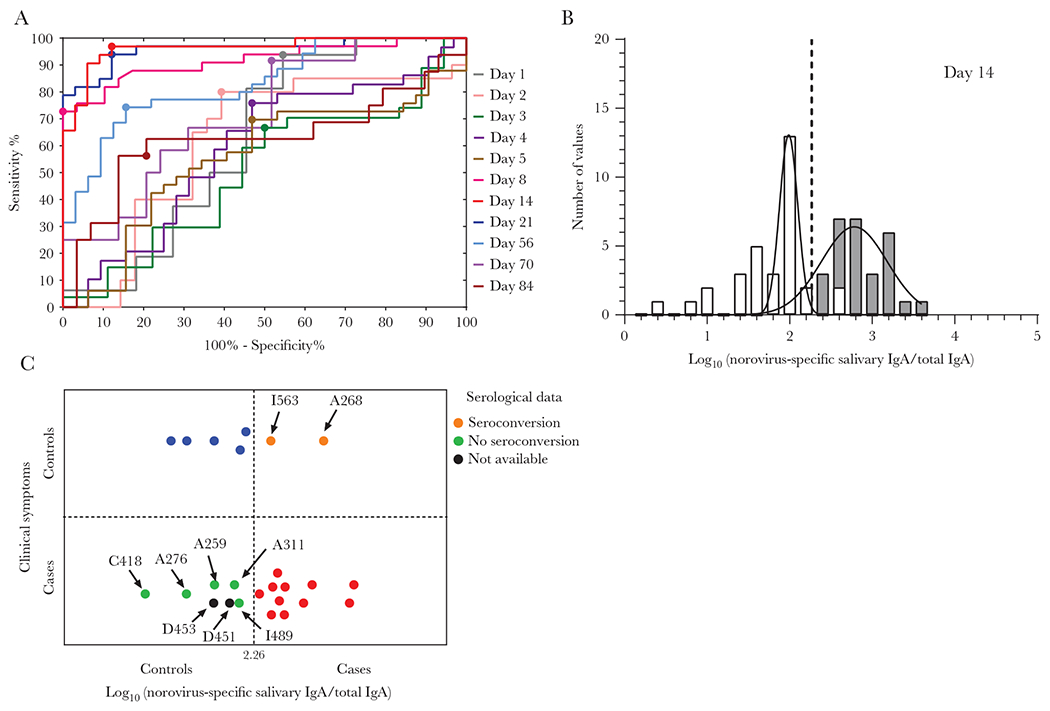
Figure 3.

Retrospective analysis of norovirus-specific salivary IgA levels as biomarker for infection. A, Receiver operating curves for each day were constructed with data from 39 cases with positive acute stool, as well as 25 controls with negative acute stool and no IgG seroconversion. The optimal threshold value to differentiate cases from controls was set as the maximum Youden’s index (sensitivity + specificity − 1) represented with a large circle for each curve. B, Frequency distribution of observed norovirus-specific salivary IgA for cases (gray) and controls (white) at day 14 and fitted normal distribution (lines). Vertical line indicates the cutoff value (sensitivity: 96.88%; specificity: 87.88%) based on ROC at day 14 with the highest AUC value of 0.963 (P < .0001). C, Retrospective classification of cases and controls with negative or without acute stool sample, based on norovirus-specific IgA levels on day 14. In 11 (red circles) of the 18 cases, and 5 (blue circles) of 7 controls the retrospective norovirus diagnosis based on salivary IgA agree with the symptomatology. Serological data (as IgA/IgG seroconversion) were used to classify samples when clinical and retrospective IgA results did not match (orange and green circles). Abbreviations: AUC, area under the curve; IgA, immunoglobulin A; IgG, immunoglobulin G; ROC, receiver operating curve. See online version for color figure.
