
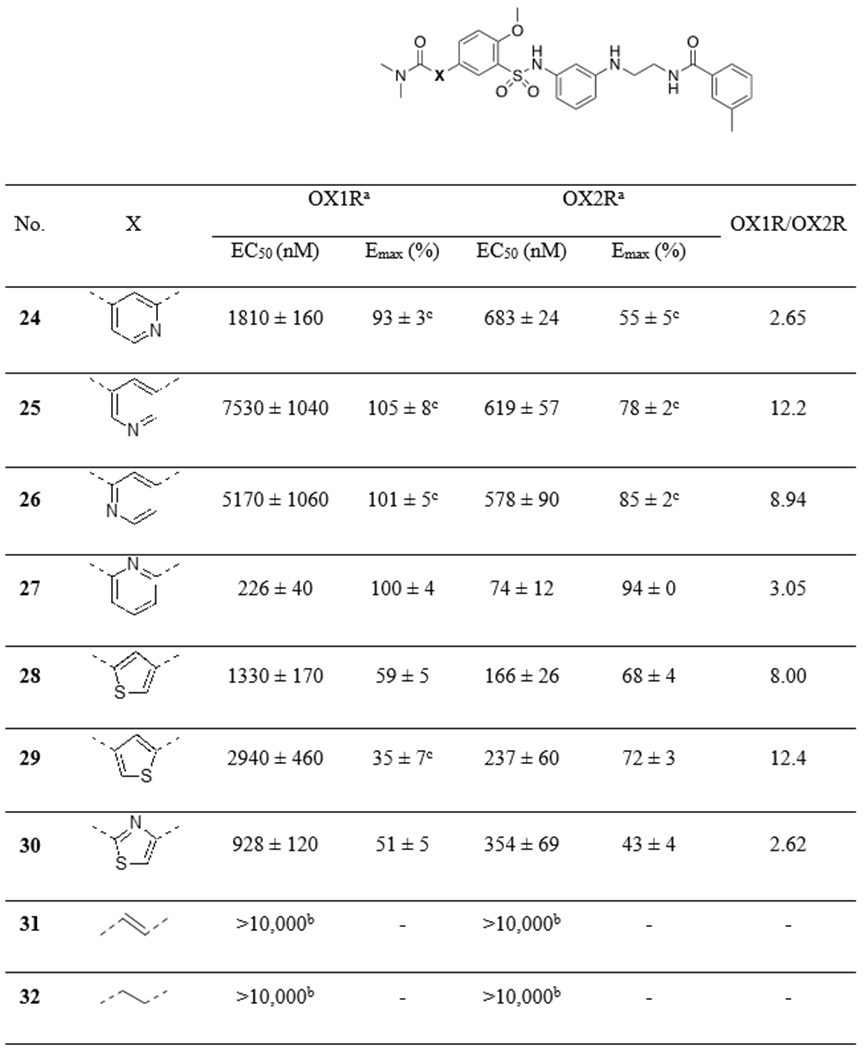
Table 3:
|
a
EC50 and Emax values (% of orexin-A control) are the means ± S.E.M. of at least three independent experiments conducted in duplicate.
b
Values are from two independent experiments conducted in duplicate.
c
Concentration-response curve does not have a top plateau.