
Fig. 1.
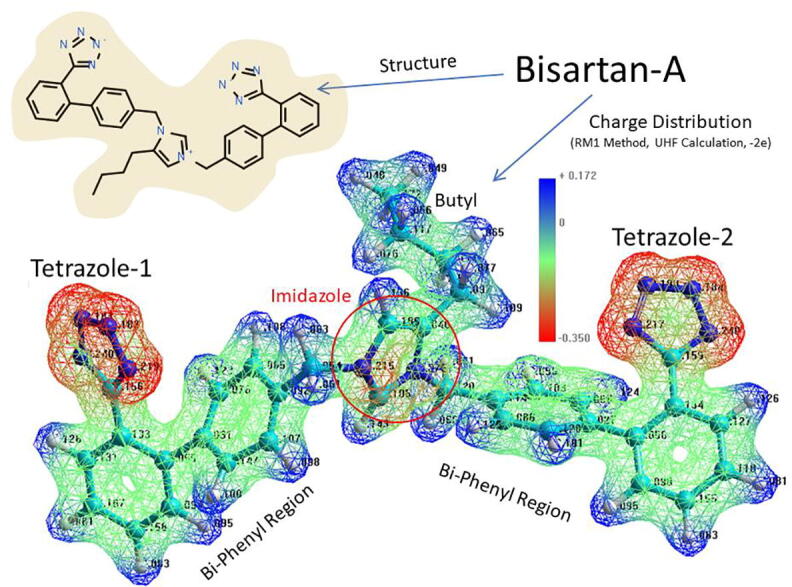
Structure (upper left) and electrostatic charge distribution (lower image) of bisartan A (BisA). Negatively charged regions = red; neutral to positive regions = green to blue. Charge distribution calculated using the RM1 semiempircal method (UHF calculation, total charge = −2.0e, geometry-optimized structure @ 0.1 kcal/mol-Å gradient).