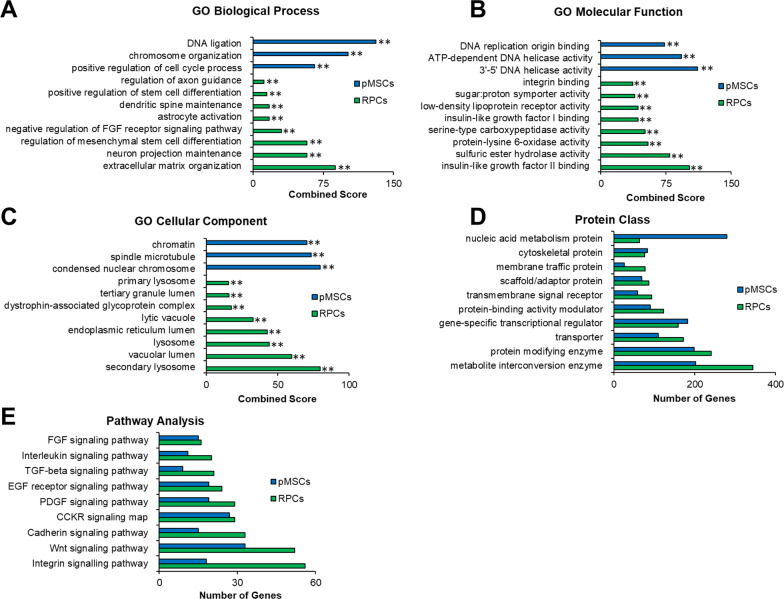
Fig. 3.
GO analysis of RNASeq of pMSCs and RPCs. Enrichr and PANTHER analyses of DEGs was performed with Benjamini–Hochberg FDR < 0.05 using DESeq2. A–C GO term enrichment analysis depicting upregulated DEGs associated with biological processes, molecular function, and cellular component, respectively, and the x-axis represents the combined score generated by Enrichr (**p ≤ 0.01). (D and E) Protein classes and pathways upregulated in pMSCs and RPCs, as determined by PANTHER analysis. The x-axis represents the number of genes associated with each category

