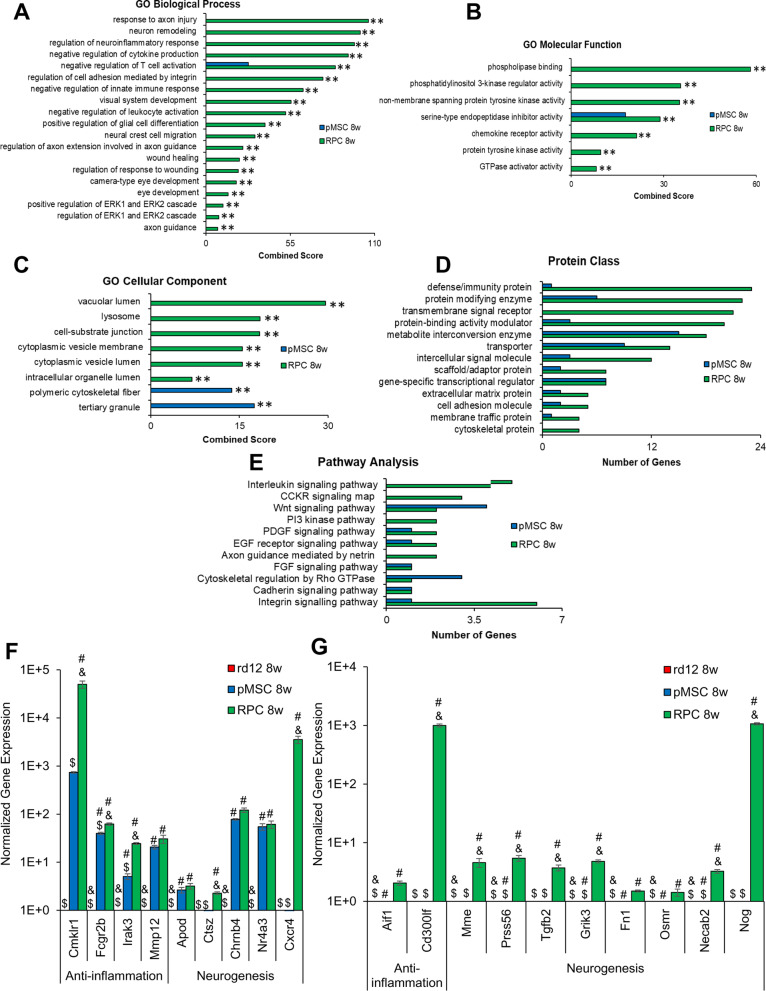
Fig. 9.
GO analysis of top mouse DEGs in rd12 mice retina transplanted with cells and validation by qRT-PCR. Enrichr and PANTHER analyses of DEGs were performed with p < 0.05 using DESeq2 after 8 week cell transplantation. A–C GO term enrichment analysis of upregulated DEGs associated with biological processes, molecular function, and cellular component, respectively, and the x-axis represents the combined score generated by Enrichr (**p ≤ 0.01). D, E Protein classes and pathways upregulated in rd12 + pMSCs and rd12 + RPCs, as determined by PANTHER analysis. The x-axis represents the number of genes associated with each category. F, G Expression of anti-inflammatory and neurogenesis genes in rd12, rd12 + pMSCs and rd12 + RPCs and expression ± SEM normalized to rd12 and r12 + pMSCs, respectively, as determined by qRT–PCR. Symbols, #, & and $ indicate significant difference at p ≤ 0.01 between all experimental conditions: rd12, rd12 + pMSCs and rd12 + RPCs, respectively

