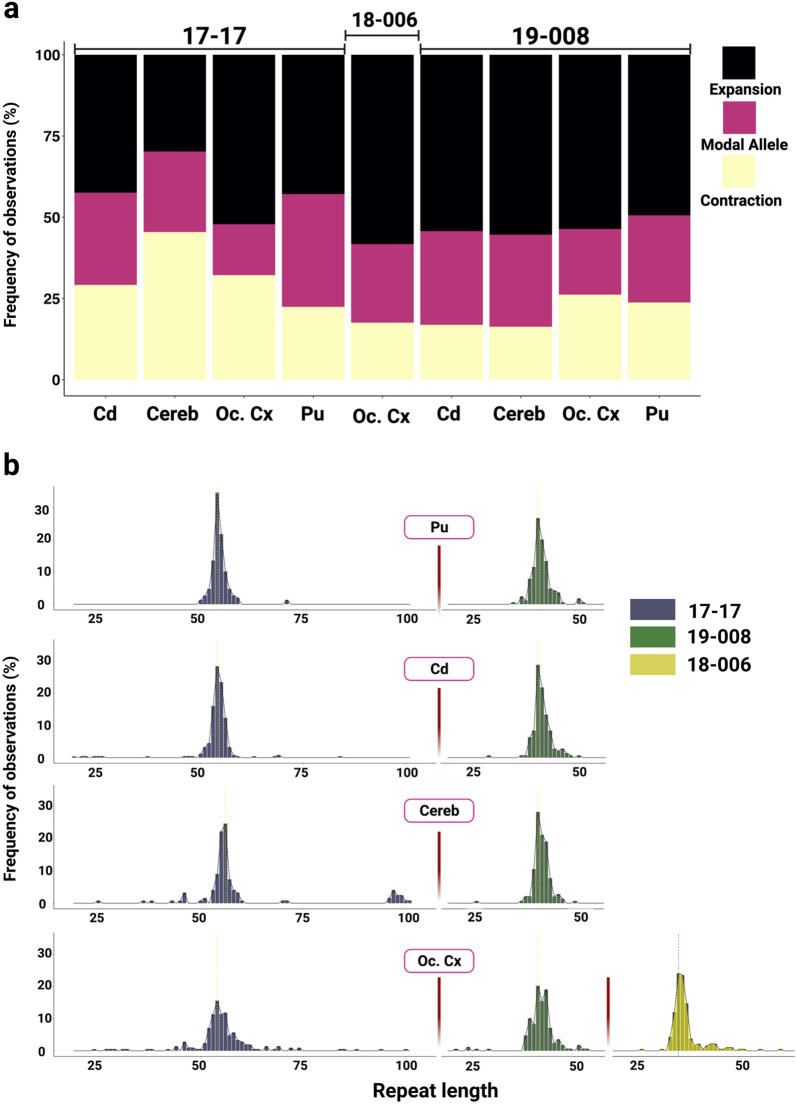
Fig. 4.
XDP CCCTCT repeat length distributions in brain regions. Repeat lengths were determined by fragment sizing of amplicons obtained in single molecule input PCRs in four tissues (Pu = putamen, Cd = caudate, Cereb = cerebellum, Oc. Cx = occipital cortex) across three patients. a Percentages of expansions and contractions compared to the modal allele. b Histograms of repeat length frequencies. Data in a and b were derived from 121–243 single amplifiable molecules for each sample. Refer to Table 1 for summary data derived from these analyses

