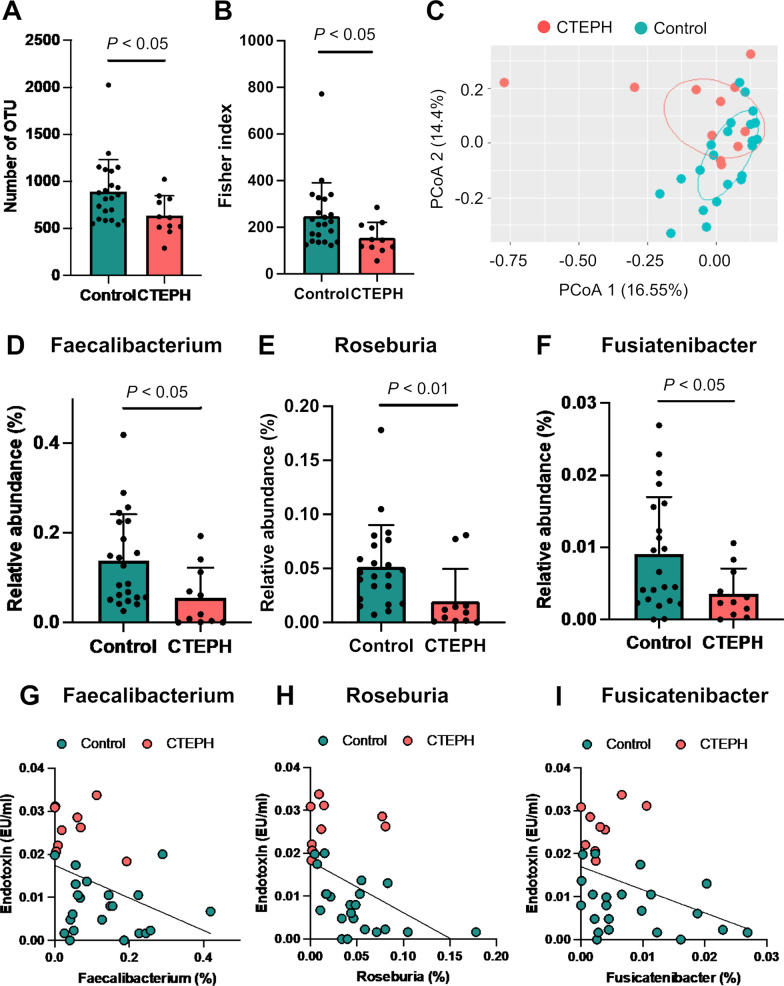
Fig. 3.
Characteristics of gut microbiota in patients with chronic thromboembolic pulmonary hypertension. a and b show the alpha-diversity indexes: a Observed operational taxonomic unit (OTU) and b Fisher index. c Principal coordinates analysis (PCoA). d to f show the relative abundances of butyrate-producing bacteria: d Faecalibacterium; f Roseburia; and f Fusicatenibacter. g to i show scatter plots between the relative abundance of butyrate-producing bacteria and plasma endotoxin levels. g Faecalibacterium and endotoxin (r = -0.365, P < 0.05) levels. h Roseburia and endotoxin (r = -0.516, P < 0.01) levels. i Fusicatenibacter and endotoxin (r = -0.397, P < 0.05) levels

