
Extended Data Fig. 10. Immunohistochemistry of STICR-Labeled Cortical INs from Xenografts at 12 weeks.
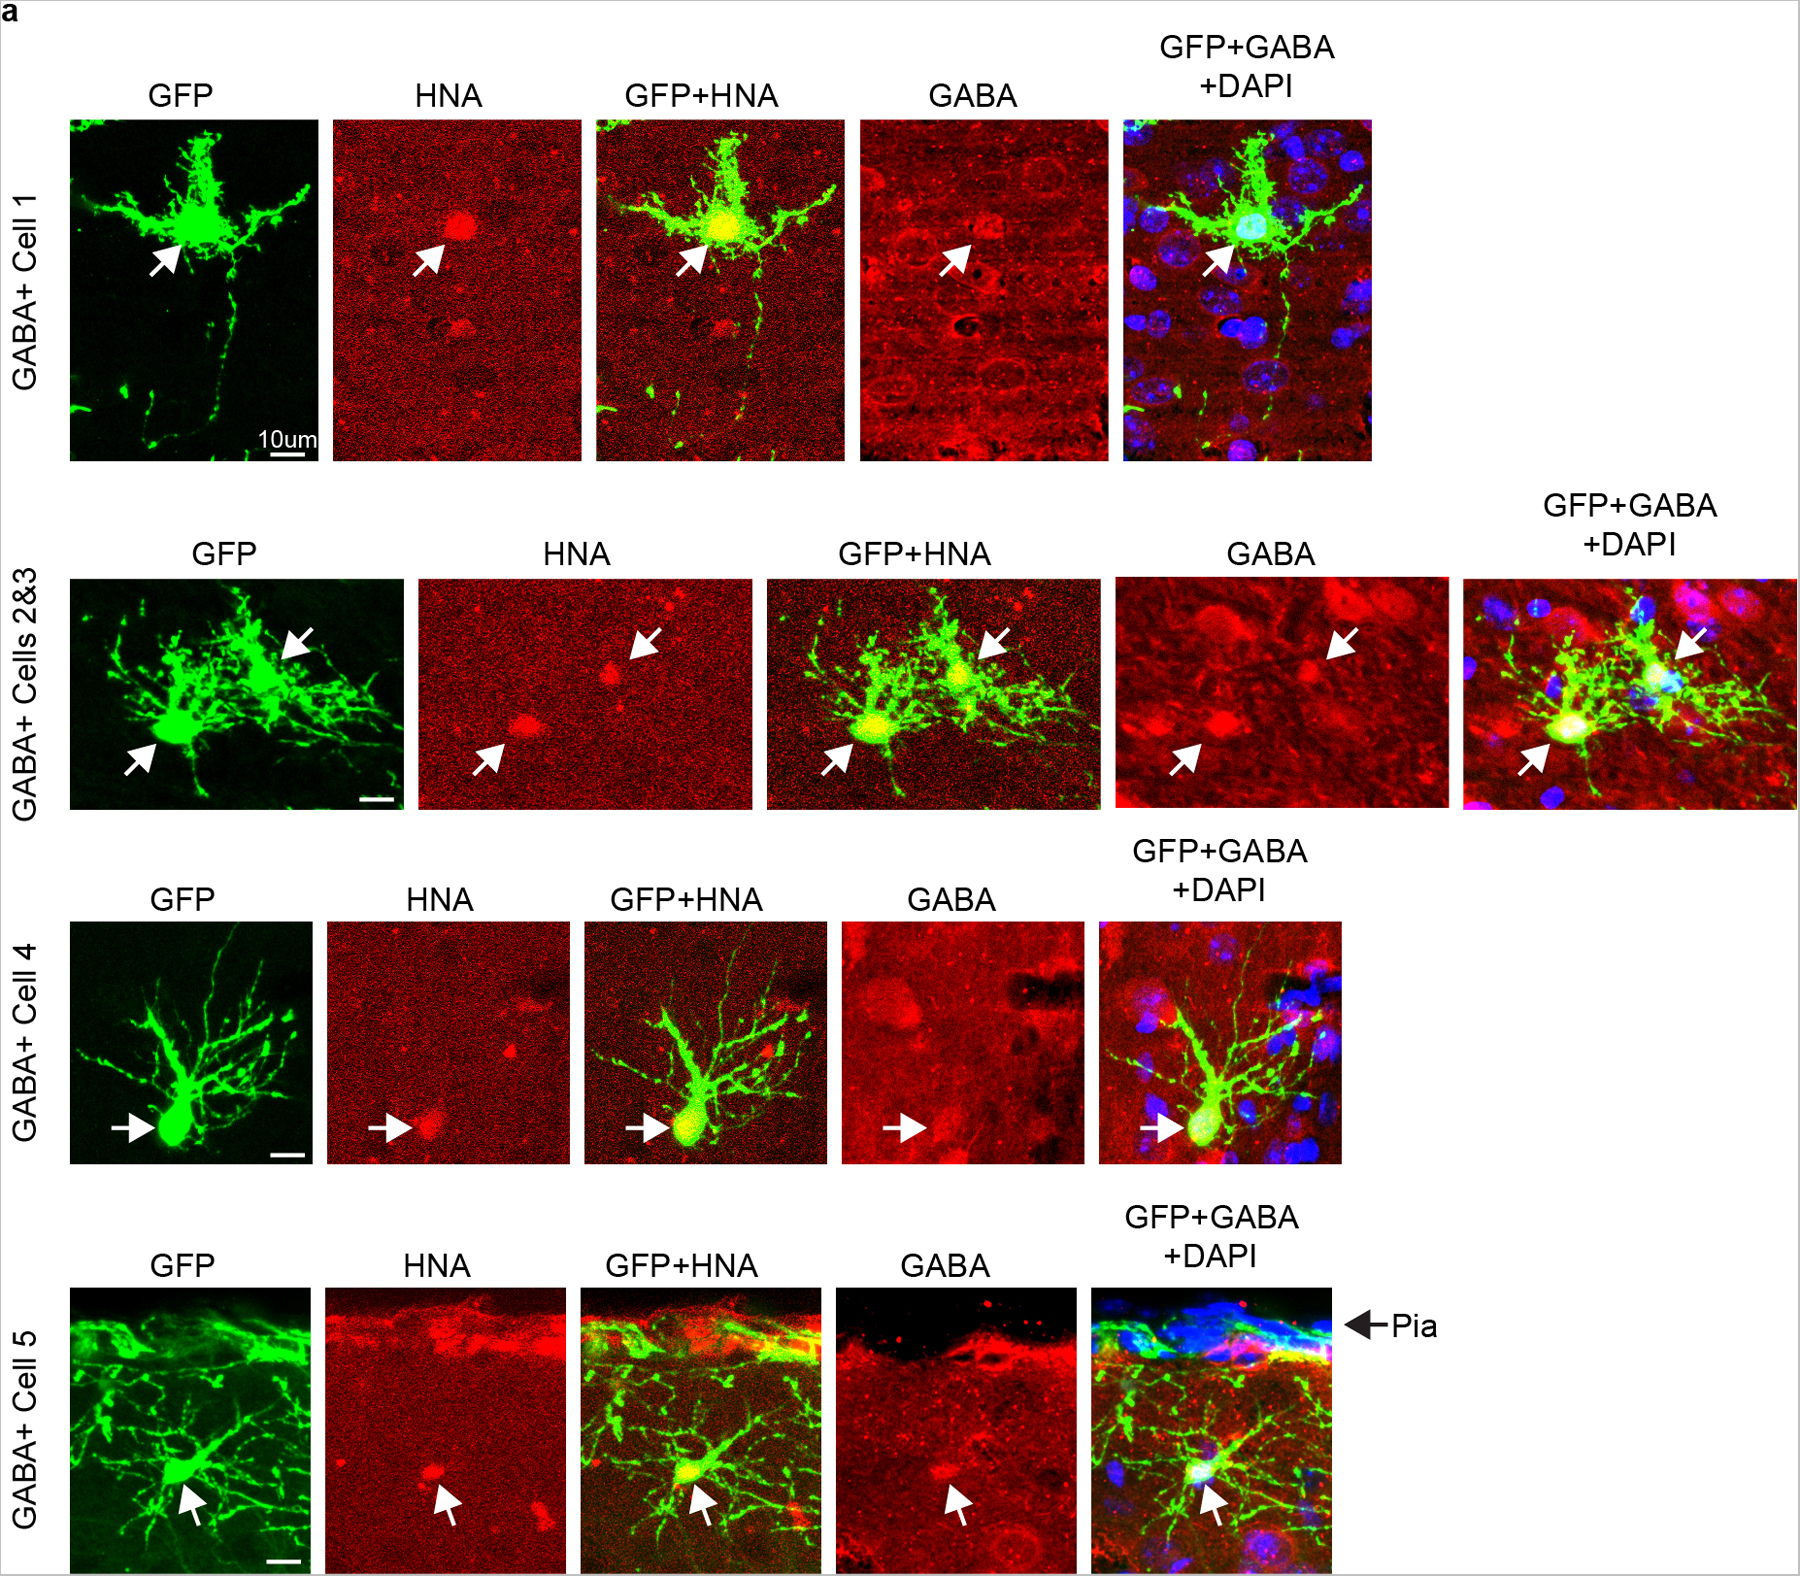
a) Representative images of STICR-labeled GABA+ cells throughout the cortical plate analyzed by IHC. EGFP from STICR in green, GABA in red, and DAPI in blue. Same cells from Fig 4d. Arrows point to STICR-labeled GABA+ cells. Scale bar, 10μm.