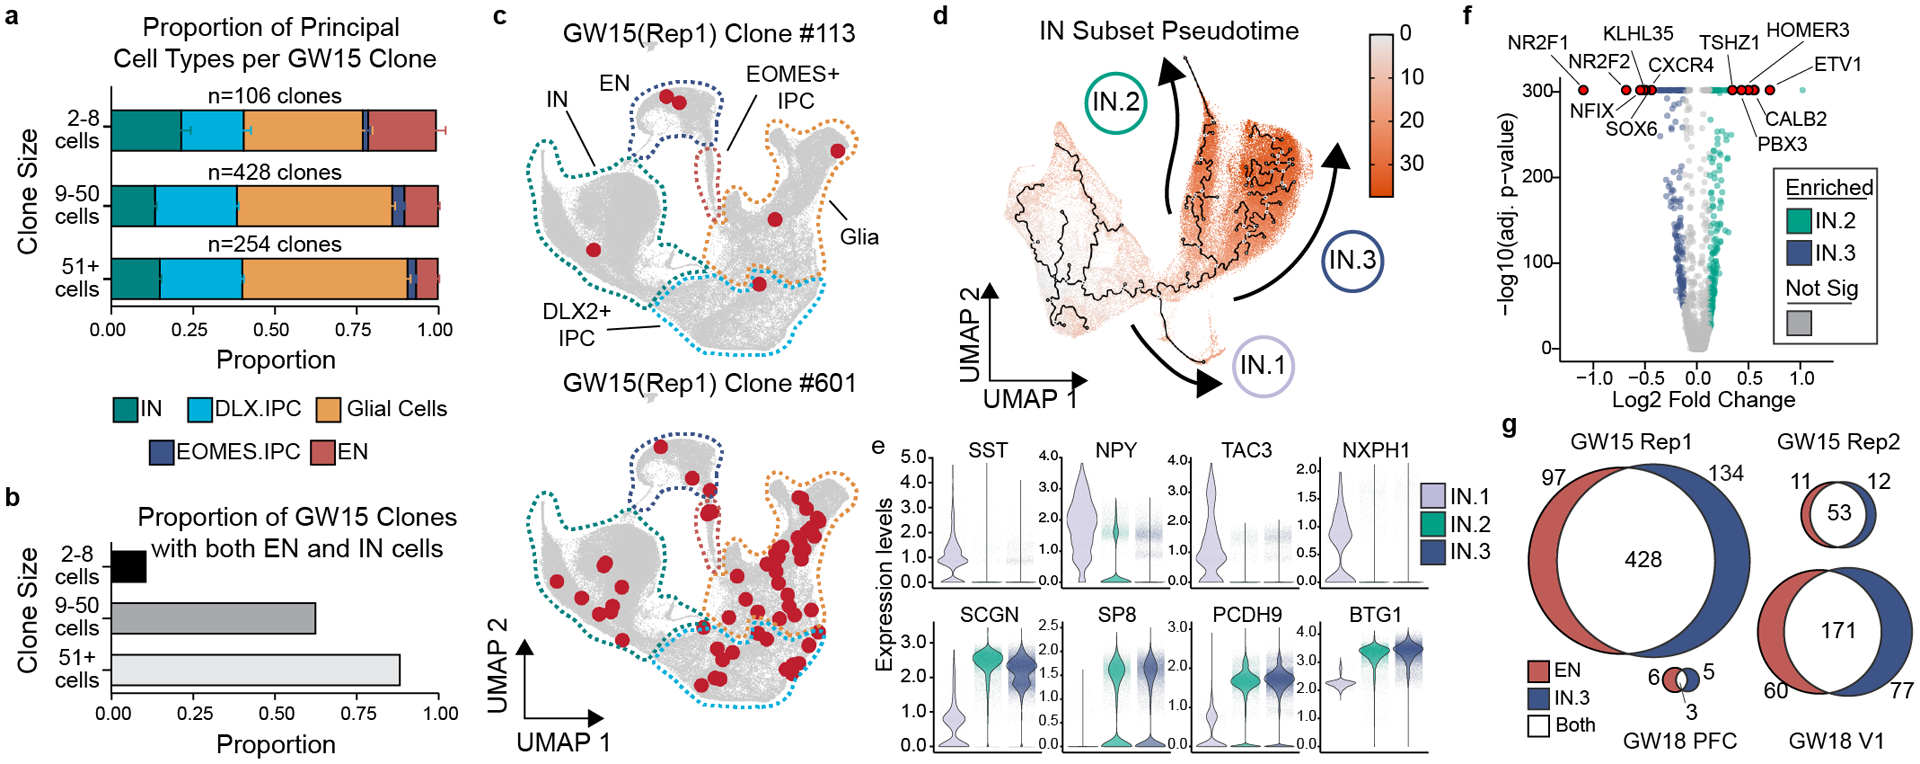
Figure 2. Individual human cortical progenitors can generate both excitatory and inhibitory cortical neurons in vitro.

a) Stacked boxplot depicting the average (mean±SD) proportion of GABAergic inhibitory neurons, DLX2+ IPCs, EOMES+ IPCs, excitatory neurons, and glia in different sized clones. b) Bar graph depicting the proportions of clones of different sizes that contain both EN and IN cells. c) Representative 6 cell (GW15, Rep1, #113) and 61 cell (GW15, Rep1, #601) clones depicted in UMAP space. Cells within each clone colored in red. Dashed lines depict borders of principal cell types from Fig. 1c. d) Pseudotime transcriptional trajectories of subclustered inhibitory neurons. Three different interneuron transcriptional trajectories (IN.1, IN.2 and IN.3) indicated with arrows. e) Violin plots depicting gene expression of IN.1 marker genes (SST, NPY, TAC3, and NXPH1) and general CGE marker genes (SCGN, SP8, PCDH9, and BTG1) in IN.1, IN.2, and IN.3 trajectories. f) Volcano plot comparing gene expression differences between IN.2 and IN.3 trajectory cells. g) Venn diagram depicting the number of multicellular cortical clones that contain IN.3 or EN cells.
