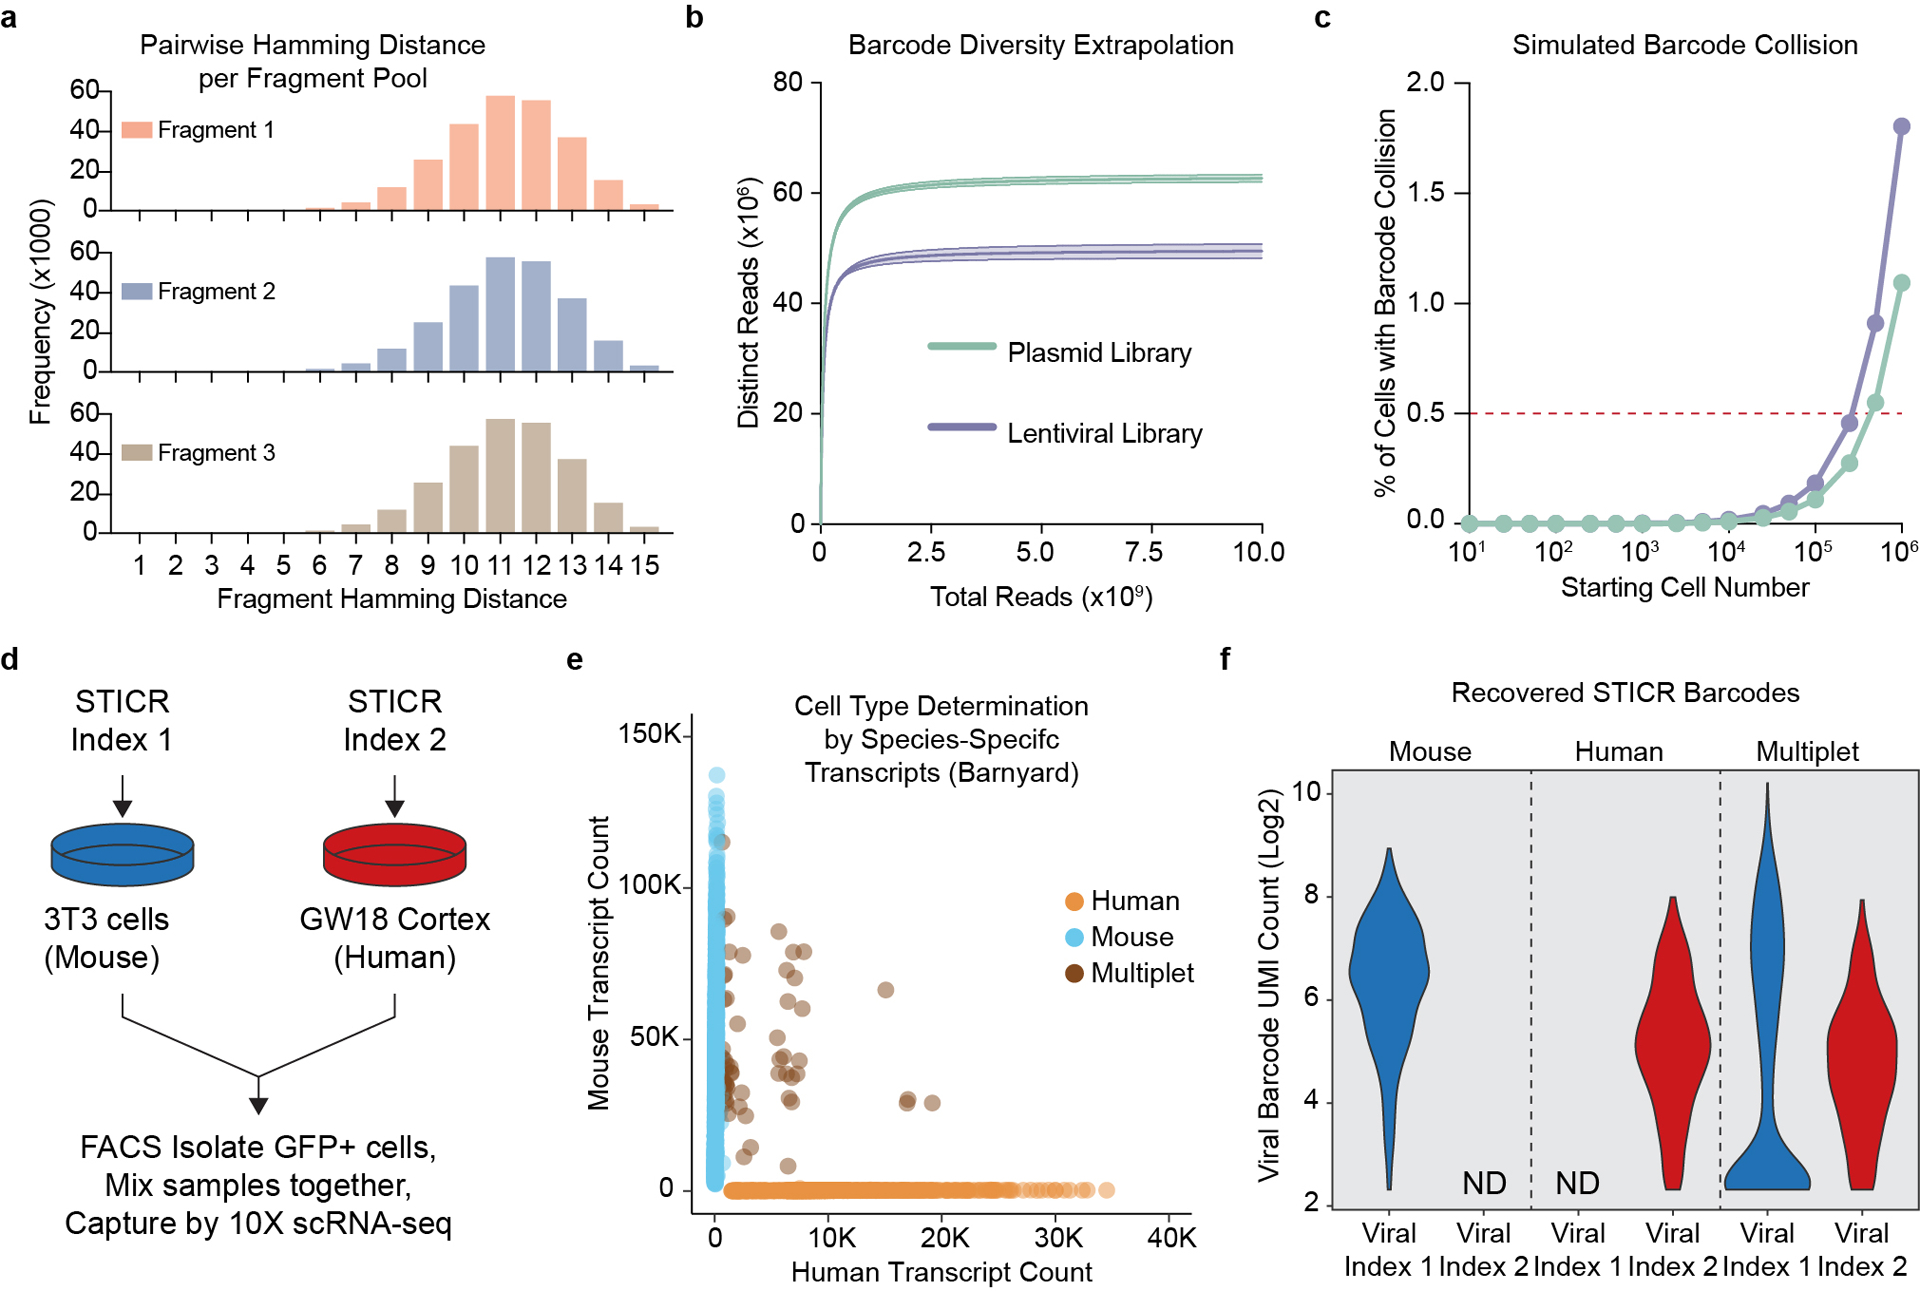
Extended Data Fig. 1. Validation of the STICR Barcode Design.

a) Histogram of pairwise hamming distances between every sequence in each STICR fragment pool. b) Barcode diversity extrapolations derived from sequencing ~30 million reads of a representative STICR plasmid or lentiviral library. Mean±95% confidence range for each library shown. c) Simulated barcode collision frequencies (mean±SD) for a range of starting cell numbers based on barcode diversity estimated in (b). Barcode sampling performed with replacement using measured proportions of barcodes within representative plasmid library depicted in panel b. Each simulation performed 20,000 times. Most error bars (depicting standard deviation) are not visible as they are smaller than the dots (depicting mean value). d) Schematic of “barnyard” species mixing experiment. e) Plot depicting species specific transcript counts from barnyard experiment. Each dot depicts a single cell and the dot color indicates whether the cell was determined to be a 3T3 cell (mouse), Cortex cell (human), or mixed droplet (multiplet). f) Violin plots depicting the number of unique STICR barcode molecules recovered from droplets identified as either mouse, human, or multiplet. ND, not detected.
