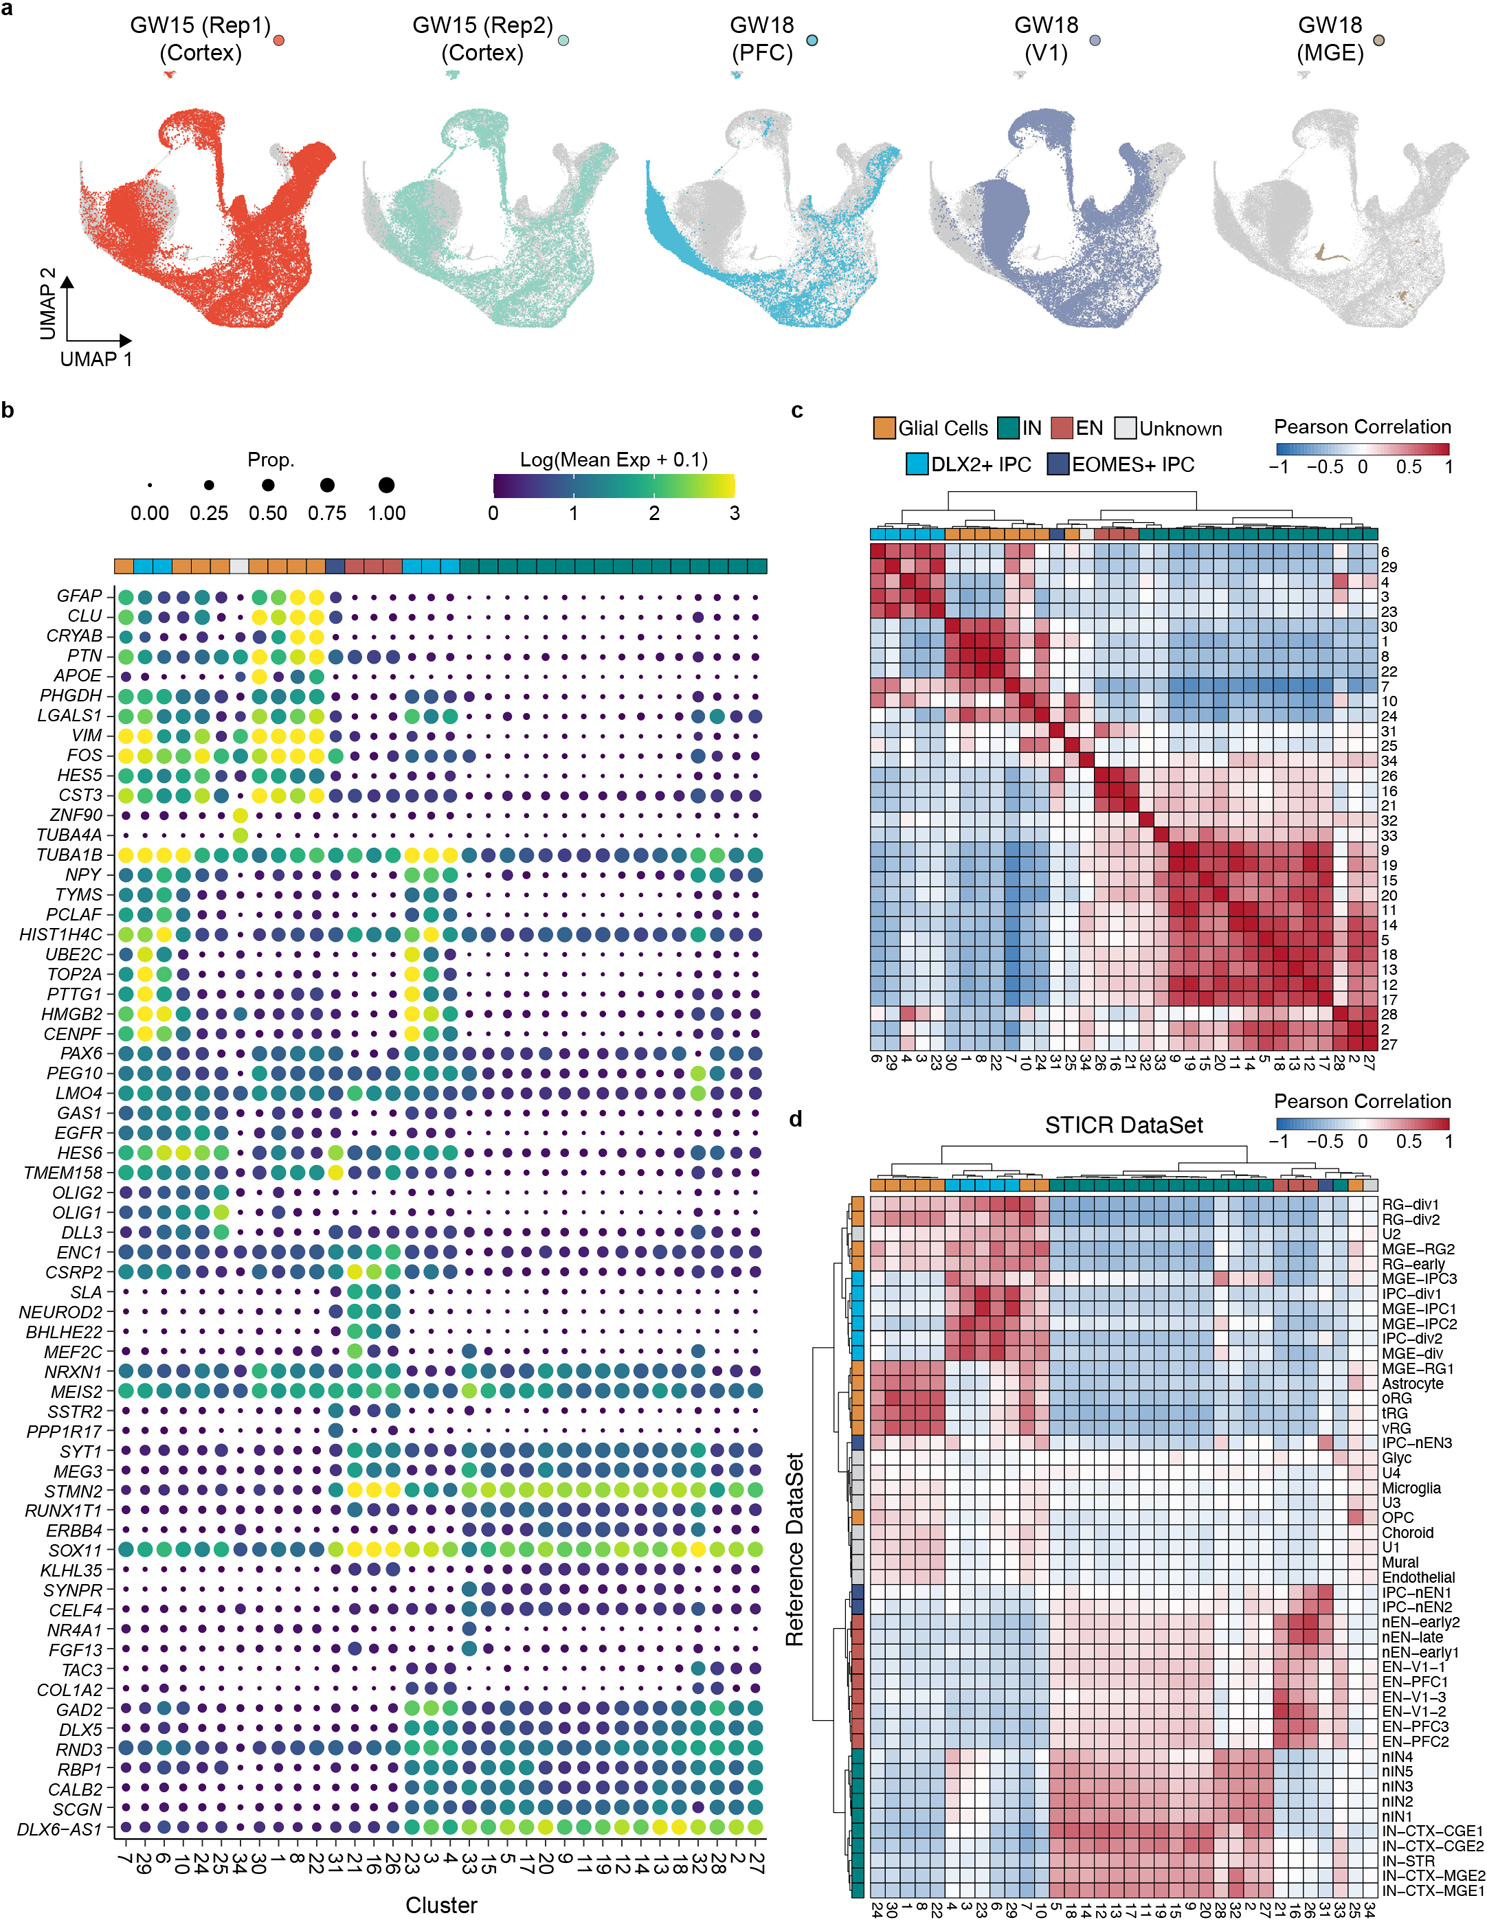
Extended Data Fig. 2. Cluster Analysis of In Vitro STICR Datasets.

a) UMAP plots of each individual biological sample highlighted. b) Top marker gene expression for each cluster. Size of dot corresponds to the proportion of cells in cluster expressing gene while the color of dot corresponds to the average expression level per cluster. c-d) Heatmap depicting pairwise transcriptional cluster correlation of in vitro cultured cells with c) self and d) 2017 Nowakowski et al scRNA-seq atlas. Principal cell type designation depicted next to each column and row. Dendrogram depicts hierarchical clustering distance.
