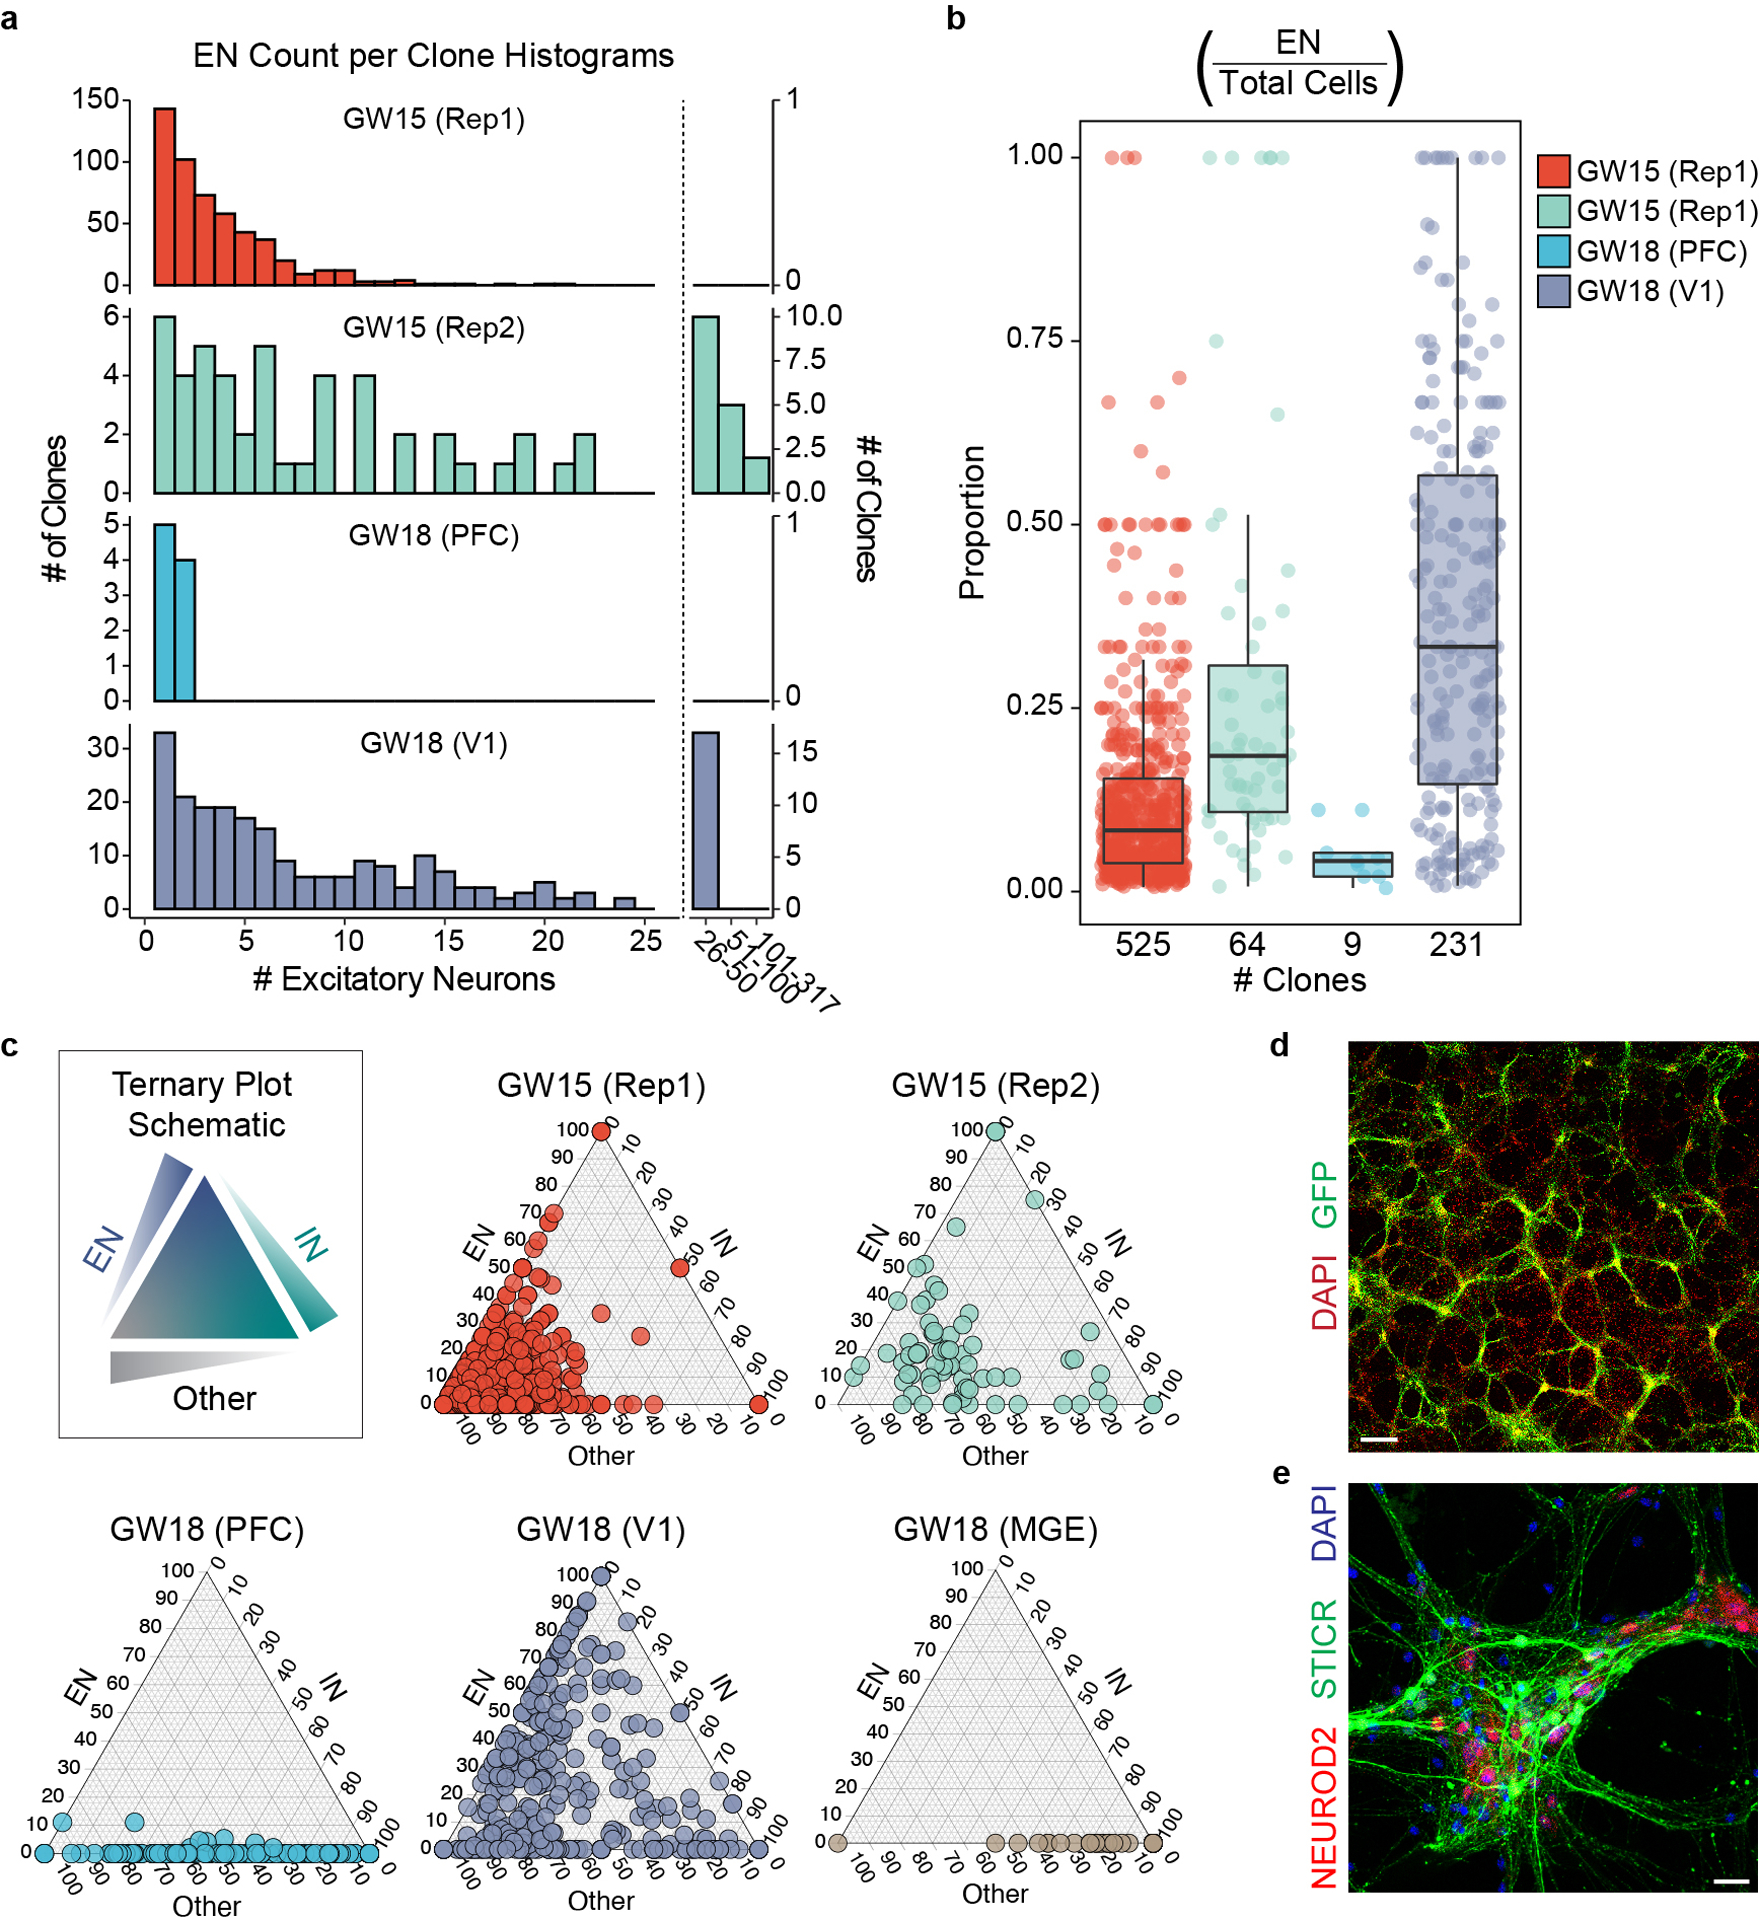
Extended Data Fig. 4. Clonal Analysis of EN-Containing Cortical Clones.

a) Histogram of excitatory neuron counts within each multi-cell cortical clone. Left, clone sizes from 1–25 cells in single cell bins. Right, clone sizes of >25 cells in indicated bin sizes. b) Box and whisker plot depicting the proportion of EN cells within individual multi-cell clones for each biological sample. Maxima and minima of box depicts 3rd and 1st quartiles, while center of box depicts the median. Whiskers depict 1.5x the interquartile distance. Individual clone value shown as dots. Number of clones is listed below each sample group. c) Ternary plots depicting the relative proportions of interneurons, excitatory neurons, and all other cell types (“Other”) within individual clones. d-e) Immunohistochemistry of in vitro cultures derived from GW15 germinal zone cells labeled with STICR. d) Low-magnification image to show distribution, Scale bar; 25μm. e) High-magnification image showing cluster of ENs, Scale bar; 250μm.
