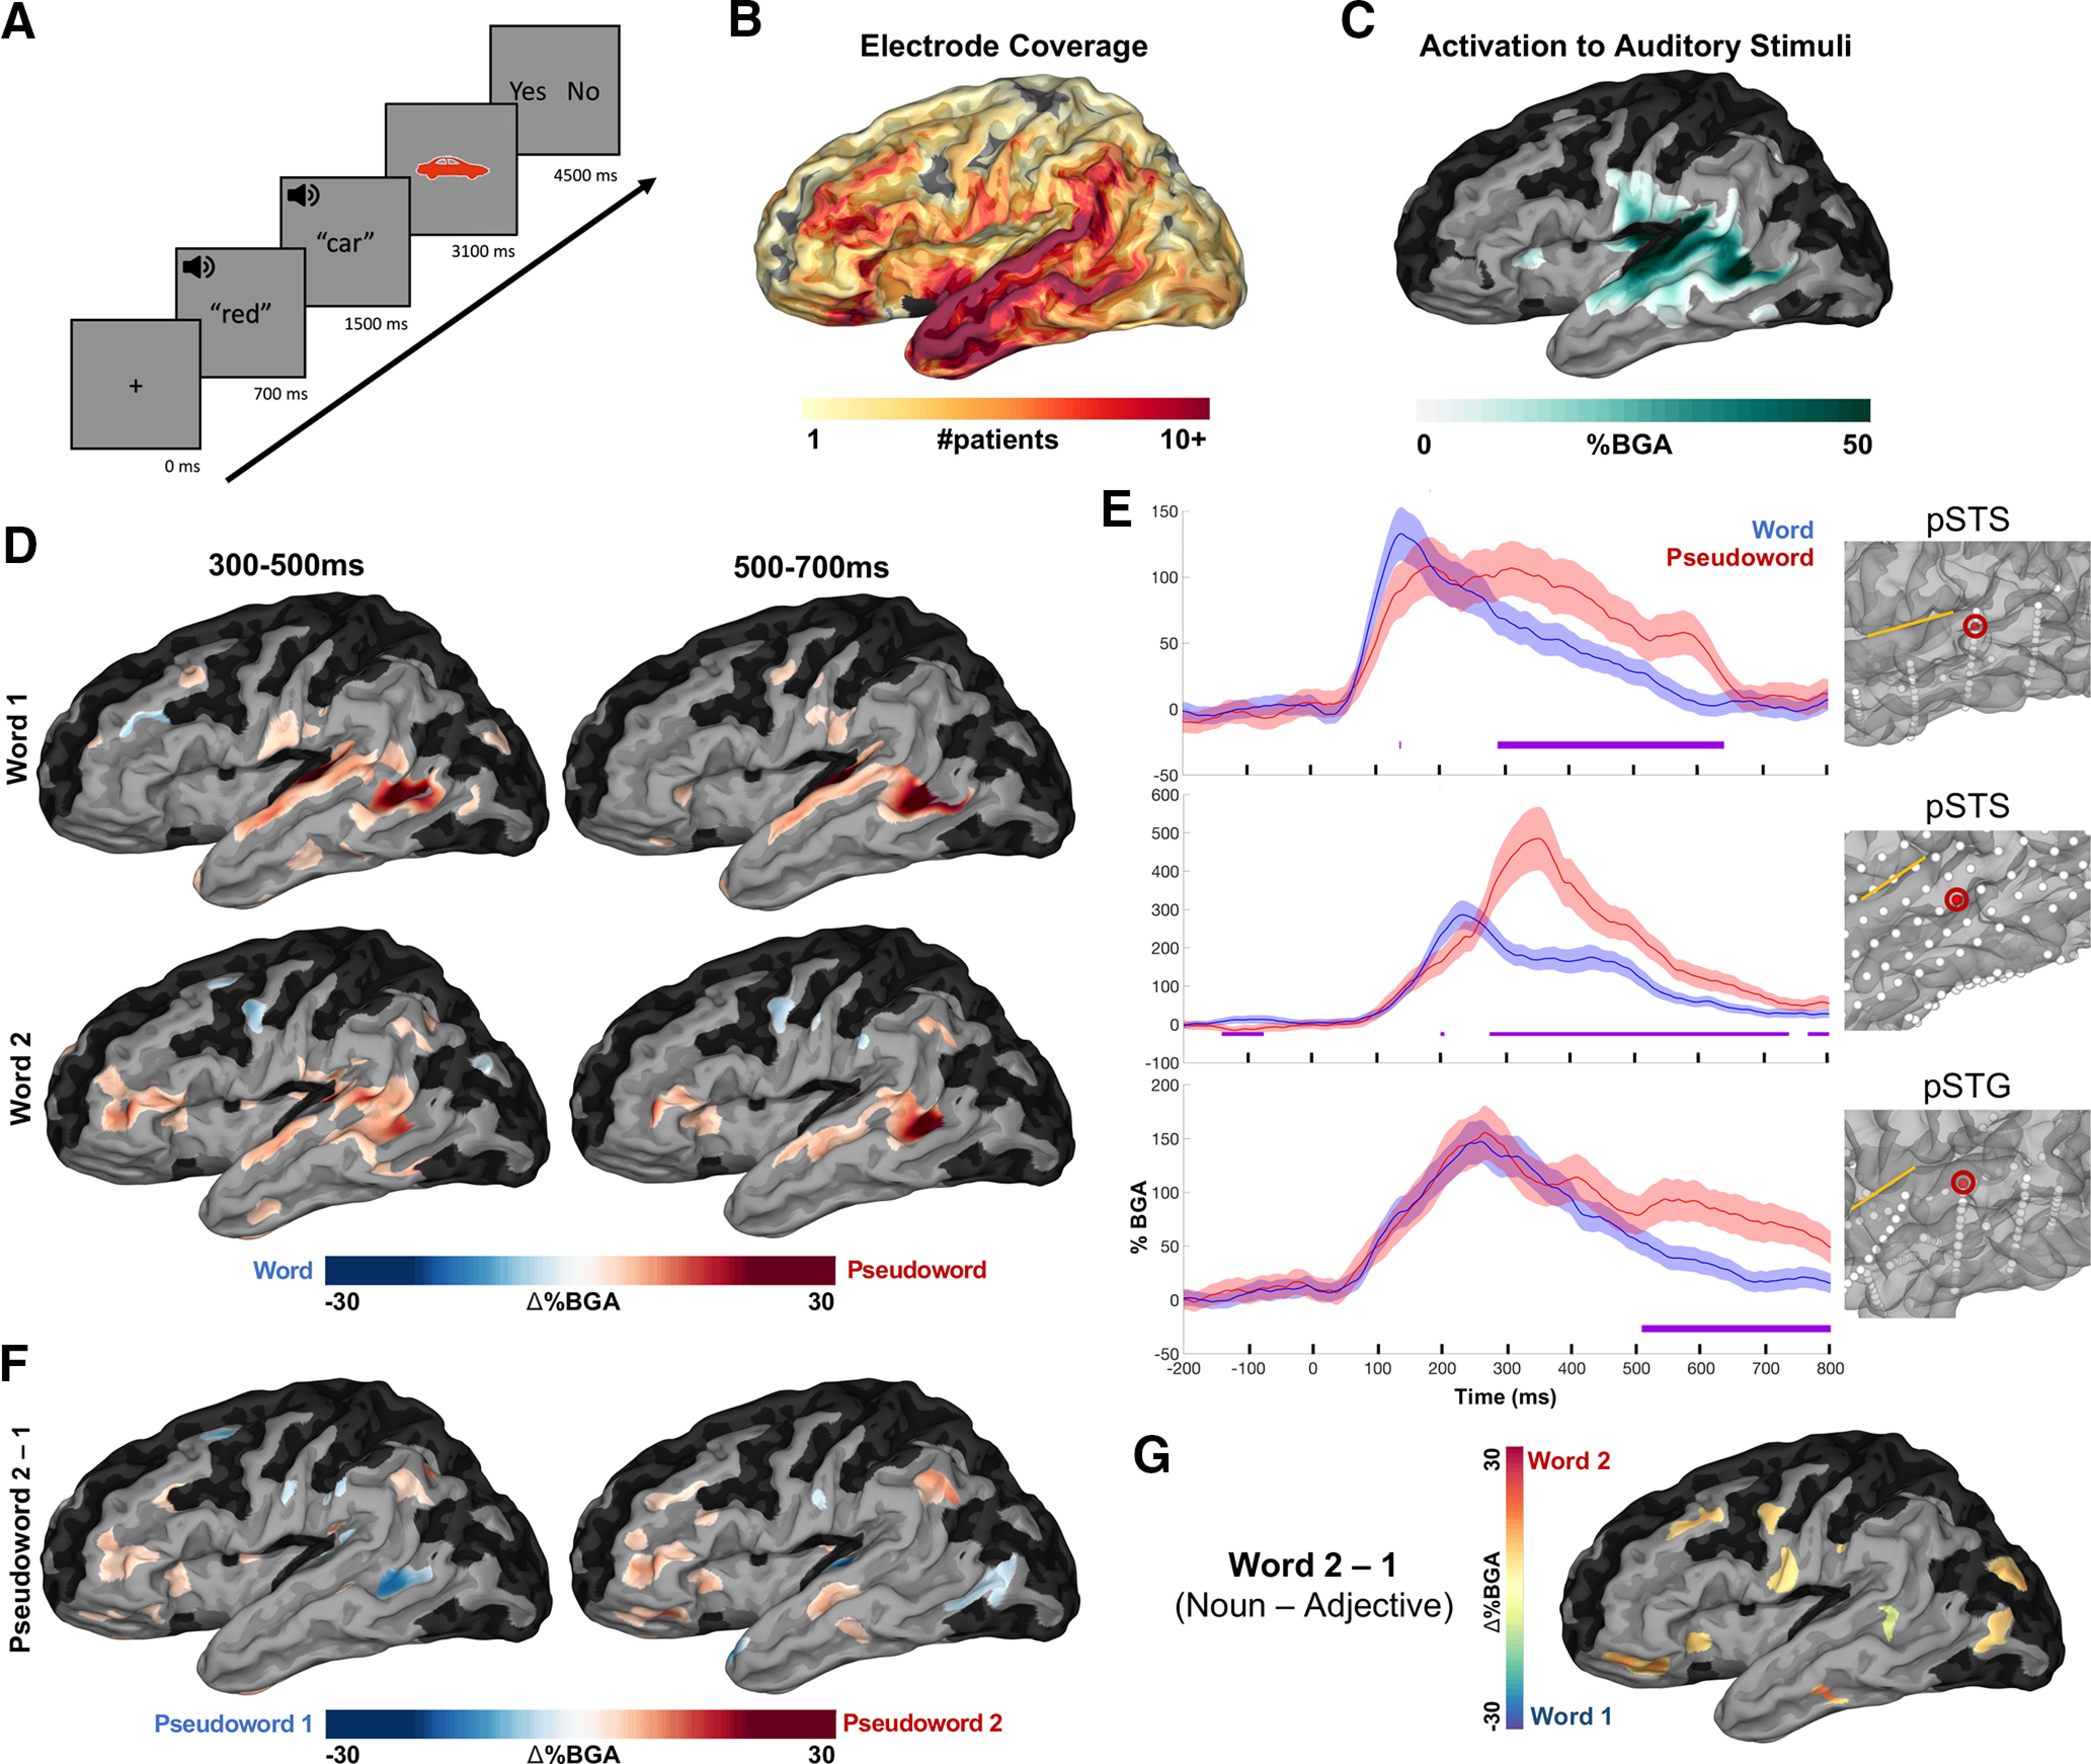
Figure 1.

Patient coverage map and grouped analysis for lexicality. A, Experimental design. Average stimuli length: adjectives (420 ± 39 ms; mean ± SD), nouns (450 ± 75 ms), pseudowords (430 ± 38 ms). B, Group coverage map of left hemisph ere electrodes included in analyses, plotted on a semi-inflated standardized N27 surface. C, BGA increases from prestimulus baseline (−500 to −100 ms before first word) for all conditions from 100 to 400 ms after first word onset (threshold: % BGA > 5%, t > 1.96, patient coverage ≥ 3; p < 0.01 corrected). Black surfaces fell below patient coverage threshold. D, SB-MEMA comparing words versus pseudowords. Red coloration indexes greater BGA (70–150 Hz) for pseudowords and blue for words (same thresholds as in C). Top, Word position 1; bottom, word position 2. E, Exemplar electrodes for the words versus pseudowords analysis. Error bars (colored shading) set at 1 SD. Sylvian fissure is marked with a yellow line for reference on each surface. Time, 0 ms indicates word 1 onset. F, SB-MEMA indicating BGA increases for pseudowords at the second word position relative to pseudowords at the first word position (time windows collapsed for both word 1 and word 2 positions). G, SB-MEMA contrast for real words from both noncompositional conditions across the 300–500 ms window (Adjective-Pseudoword and Pseudoword-Noun).
