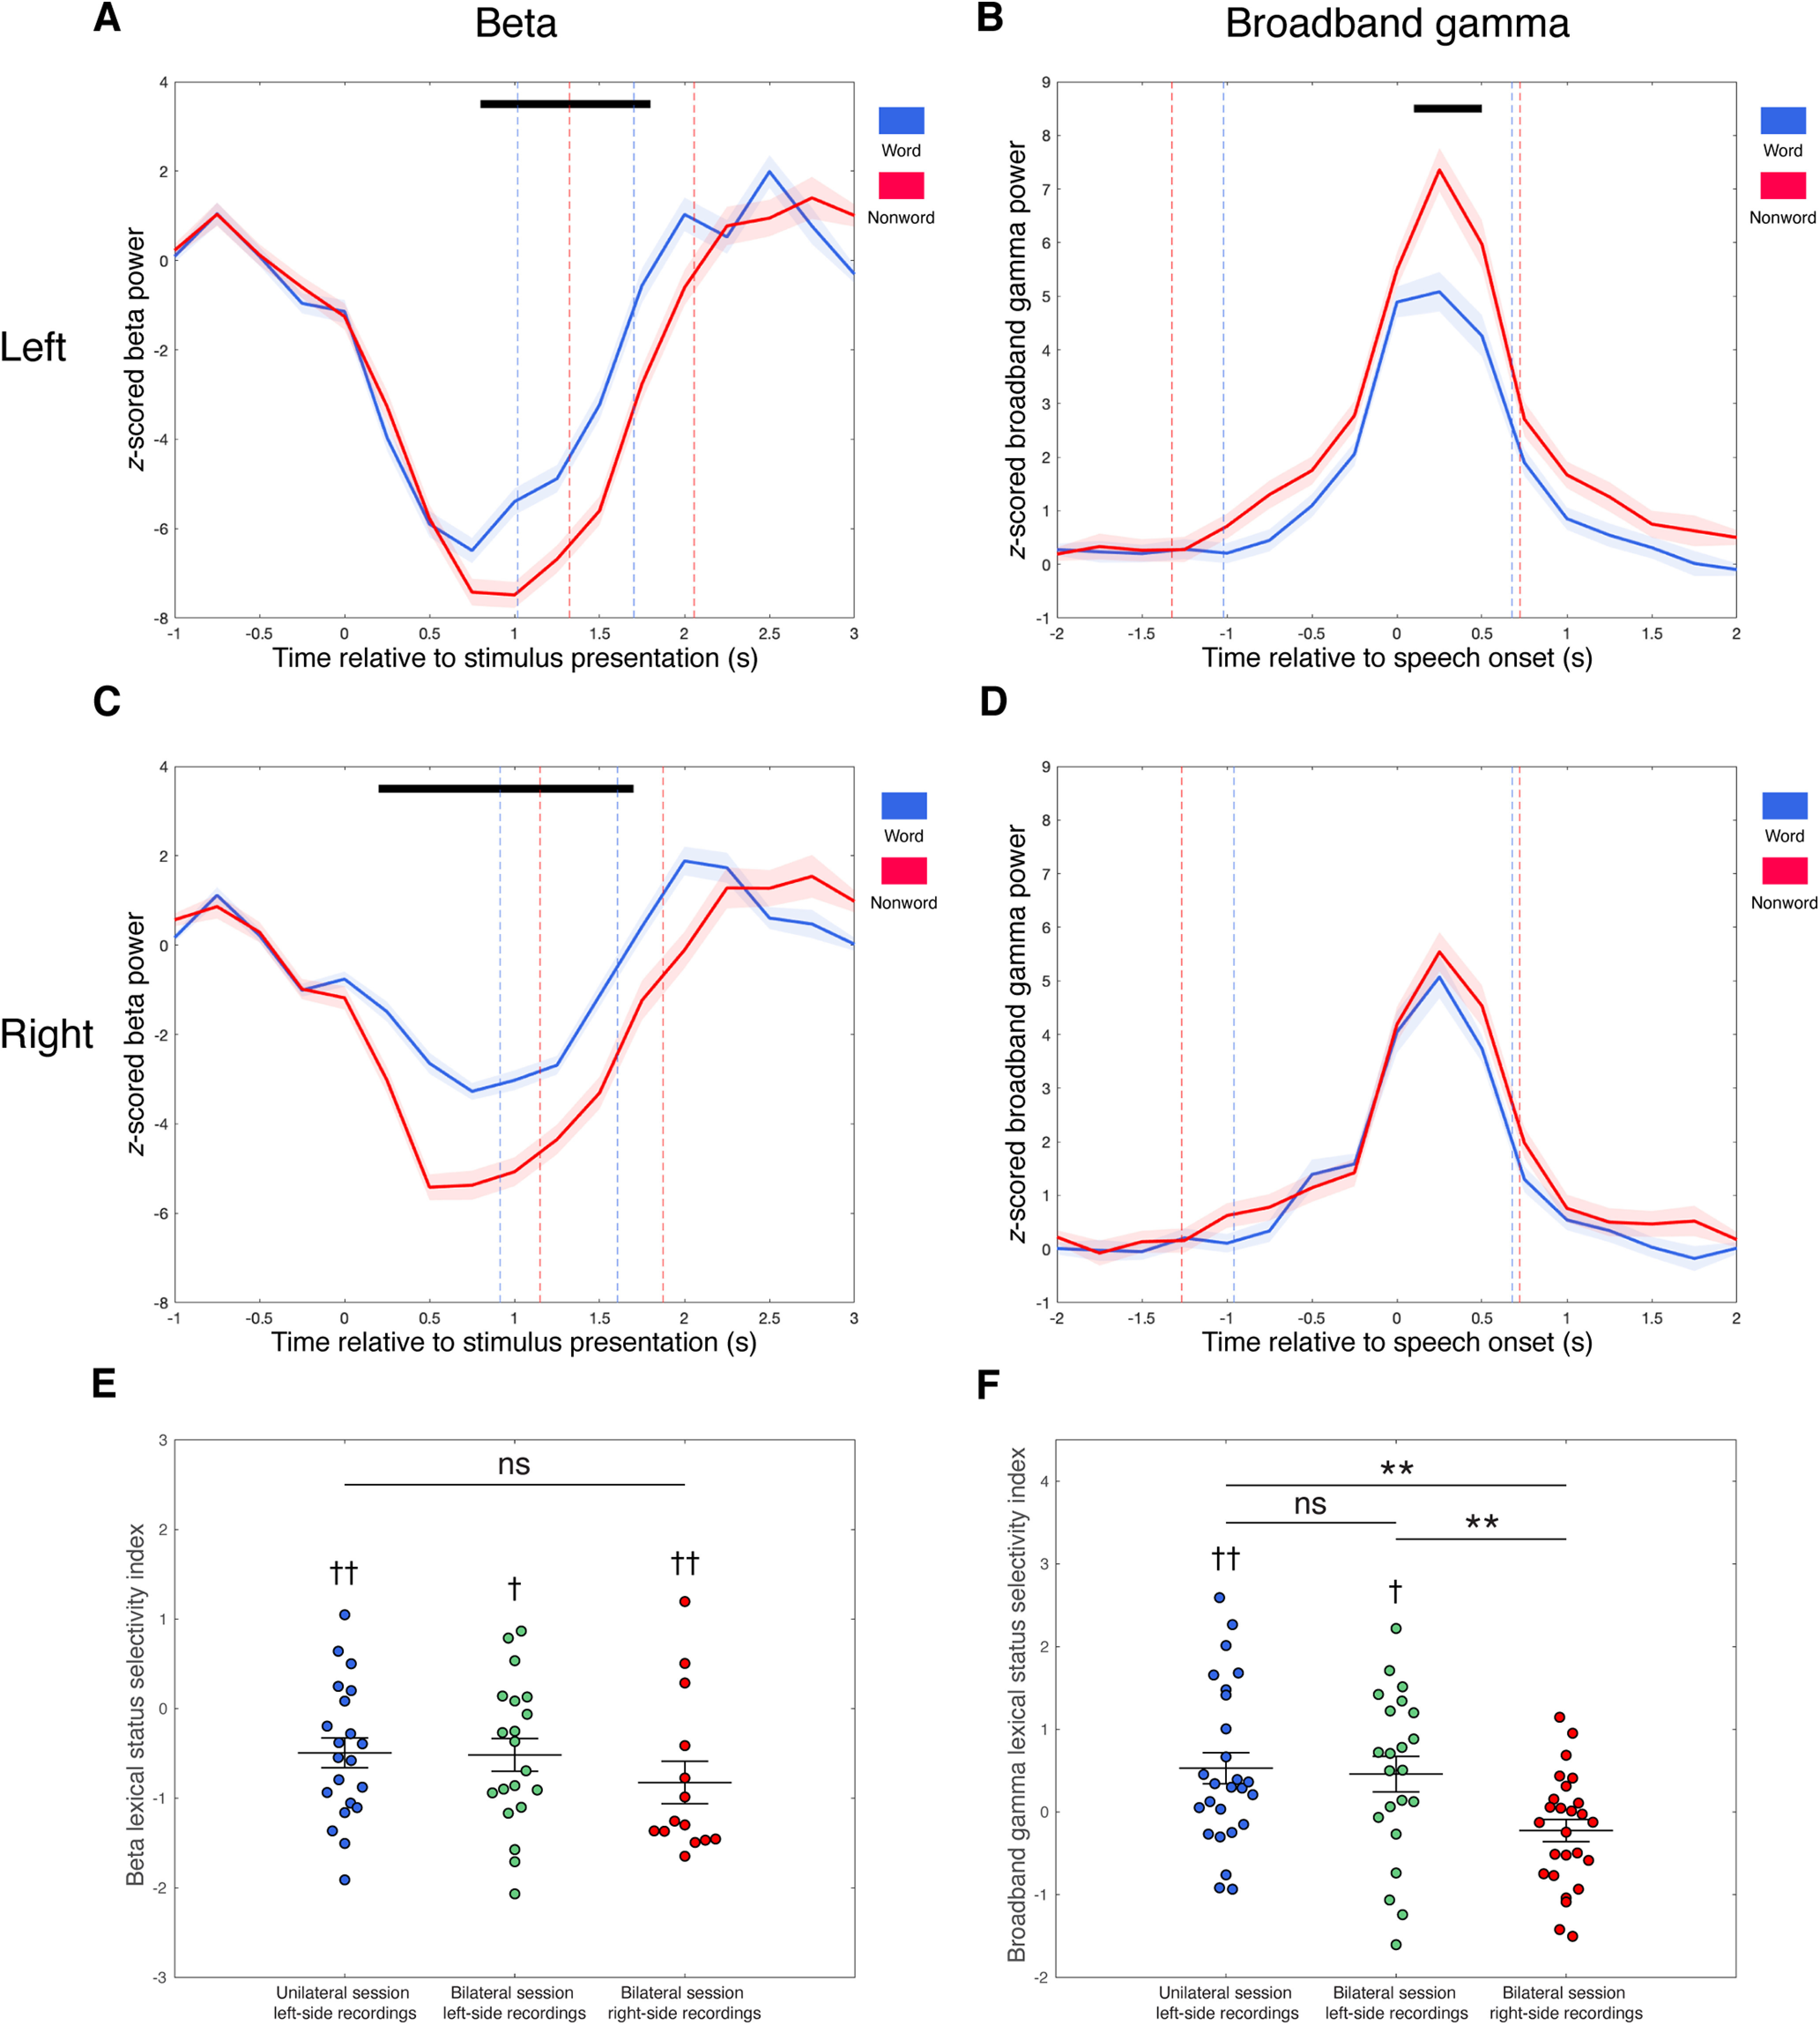
Figure 7.

Differential band responses during word versus nonword reading aloud in the left and right thalamus. A–D, Comparisons of average band response amplitudes during word (blue) versus nonword (red) reading aloud for beta band (A, C) and broadband gamma (B, D) in the left (A, B) and right (C, D) thalamus. Band responses are averaged across trials of respective trial types and across recordings that showed significant task-related band responses in each side, aligned to stimulus presentation for beta band (A, C) and speech onset for broadband gamma (B, D). Average time points of speech onset and end of speech are marked with dashed lines in A and C, and average time points of stimulus presentation and end of speech are marked with dashed lines in B and D, for word trials (blue) and nonword trials (red), respectively. Black bars indicate significant differences of response amplitudes between word and nonword trials (two-tailed paired t test, p < 0.05, Bonferroni corrected for multiple comparisons across time bins). SEs are shaded in light colors. E, Dot plot of beta lexical status selectivity indexes of lead recordings that showed significant task-related beta decrease responses, grouped by recording sides and recording sessions (unilateral session left-side recordings, left column; bilateral session left-side recordings, middle column; and bilateral session right-side recordings, right column). Mean and SE of beta lexical status selectivity index across recordings of each group is superimposed on each column, respectively. F, Dot plot of broadband gamma lexical status selectivity indexes of lead recordings that had significant task-related broadband gamma increase responses, grouped by recording sides and recording sessions (unilateral session left-side recordings, left column; bilateral session left-side recordings, middle column; and bilateral session right-side recordings, right column). Mean and SE of broadband gamma lexical status selectivity index across recordings of each group is superimposed on each column, respectively. Two-tailed one-sample t test, †p < 0.05, ††p < 0.01; two-tailed two-sample t test, **p < 0.01. ns, Not significant.
