
Figure 1.
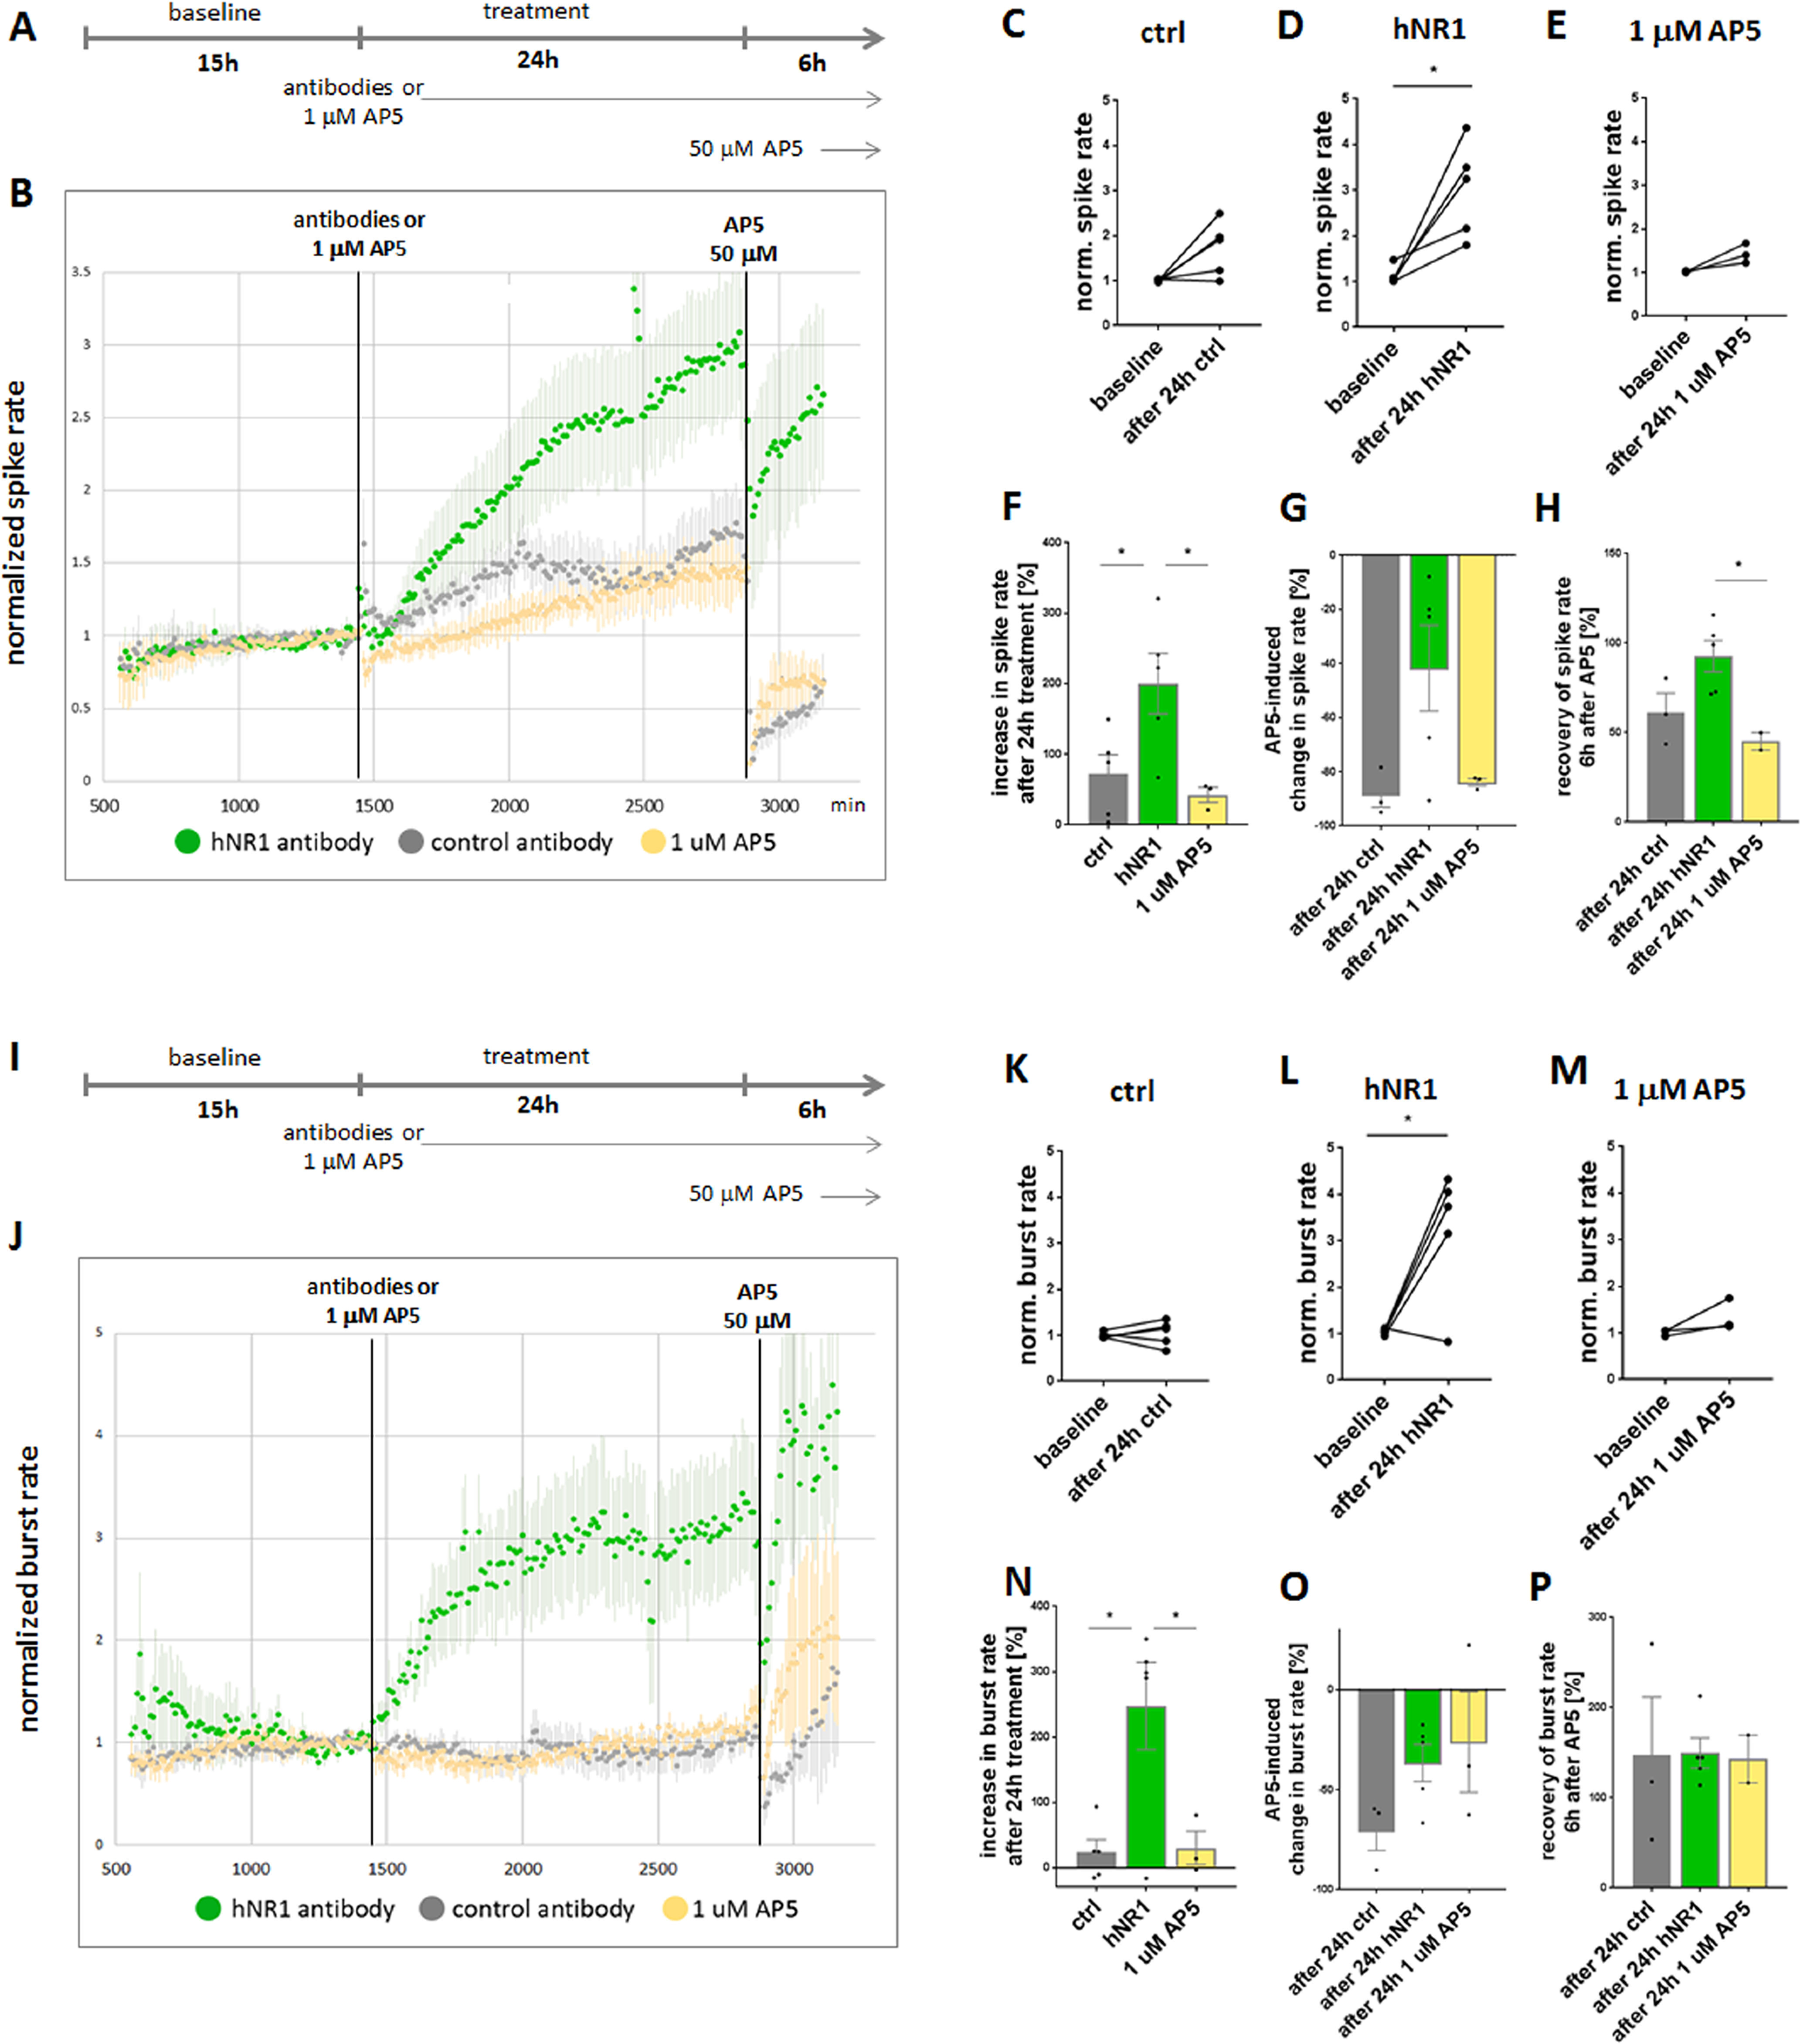
hNR1 antibody increases spiking and bursting activity of cortical cultures. A, I, Experimental design of MEA experiments. Baseline activity of cortical networks was recorded for 15 h, followed by addition of 1 μg/ml of hNR1 antibody, control (ctrl) antibody or 1 μm AP5 and 24-h recording of activity in the presence of antibodies/1 μm AP5. After 24 h of treatment, saturating concentration of AP5 (50 μm) was added to the network and another 6 h of activity were recorded. B, Normalized spike rate of neuronal networks. Each data point represents a number of spikes recorded within a 10-min interval from all 59 electrodes and normalized to the last 3 h of baseline activity. Addition of hNR1 antibody (green data points), and to a much lesser degree control (ctrl, mGO53) antibody (gray data points) or AP5 at its IC50 concentration (1 μm; yellow data points), increase spiking of the network. hNR1 = 5 independent experiments, ctrl = 5 independent experiments, AP5 = 3 independent experiments. Error bars indicate SEM. C–E, Within-dish comparison of normalized spike rate of the same network at the end of baseline recording (1 h) and after 24 h of treatment (1 h) tested by paired t test. C, Baseline = 1.01 ± 0.01, after 24 h ctrl = 1.72 ± 0.27, 5, p = 0.07. D, Baseline = 1,12 ± 0.47, after 24-h hNR1 = 3.02 ± 0.47, p = 0.02. E, Baseline = 1.02 ± 0.01, after 24 h 1 μm AP5 = 1.43 ± 0.13, p = 0.09. F–H, Percentage increase in normalized spike rate at the end (10 min) or beginning (10 min) of respective treatment. Each data point represents individual network (MEA dish). Percentage increase in spike rate: (F) at the end of baseline compared with end of antibody treatment, ctrl = 71.71 ± 27.46%; hNR1 = 200.5 ± 42.96%, 1 μm AP5 = 42.4 ± 10.76%, ctrl versus hNR1 p = 0.045, hNR1 versus 1 μm AP5 p = 0.034; (G) at the end of antibody treatment compared with beginning of 50 μm AP5, ctrl = −94.96 ± 5.03%; hNR1 = −41.69 ± 15.88%; 1 μm AP5 = −86.51 ± 1.33%, ctrl versus hNR1 p = 0.085; (H) at the end of antibody treatment compared with recovery 6 h after addition of 50 μm AP5, ctrl = 61.34 ± 10.65%; hNR1 = 92.65 ± 8.8%; 1 μm AP5 = 45.04 ± 4.88%, hNR1 versus 1 μm AP5 p = 0.038. J, Normalized burst rate of neuronal networks. Each data point represents a number of bursts recorded within a 10-min interval, normalized to the last 3 h of baseline. Network bursting increases in the presence of hNR1 antibody, but not of control antibody nor 1 μm AP5. K–M, Within-dish comparison of normalized burst rates of the same networks at the end of baseline recording (1 h) and after 24 h of treatment (1 h) tested by paired t test. K, Baseline = 1 ± 0.03; after 24 h ctrl = 1.05 ± 0.12, p = 0.72. L, Baseline = 1.04 ± 0.03; after 24-h hNR1 = 3.22 ± 0.63, p = 0.027. M, Baseline = 1 ± 0.04; after 24 h 1 μm AP5 = 1.36 ± 0.2, p = 0.2. N–P, Percentage increase in normalized burst rate at the end (10 min) or beginning (10 min) of respective treatments. Percentage increase in burst rate: (N) at the end of baseline compared with end of antibody treatment, ctrl = 23.31 ± 19.47%; hNR1 = 247.5 ± 66.75%; 1 μm AP5 = 30.14 ± 25.57%, ctrl versus hNR1 p = 0.01, hNR1 versus 1 μm AP5 p = 0.03; (O) end of antibody treatment compared with beginning of 50 μm AP5, ctrl = −70.46 ± 9.9%; hNR1 = −36.58 ± 25.24%; 1 μm AP5 = −26.05 ± 25.24%; (P) end of antibody treatment compared with recovery 6 h after addition of 50 μm AP5, ctrl = 147 ± 64.39%; hNR1 = 149.6 ± 16.73%; 1 μm AP5 = 143 ± 26.56%. Error bars indicate SEM. Paired t test (C–E, K–M) or ANOVA Tukey's multiple comparison test (F–H, N–P) were used to evaluate statistical significance. *p < 0.05.