Figure 3.

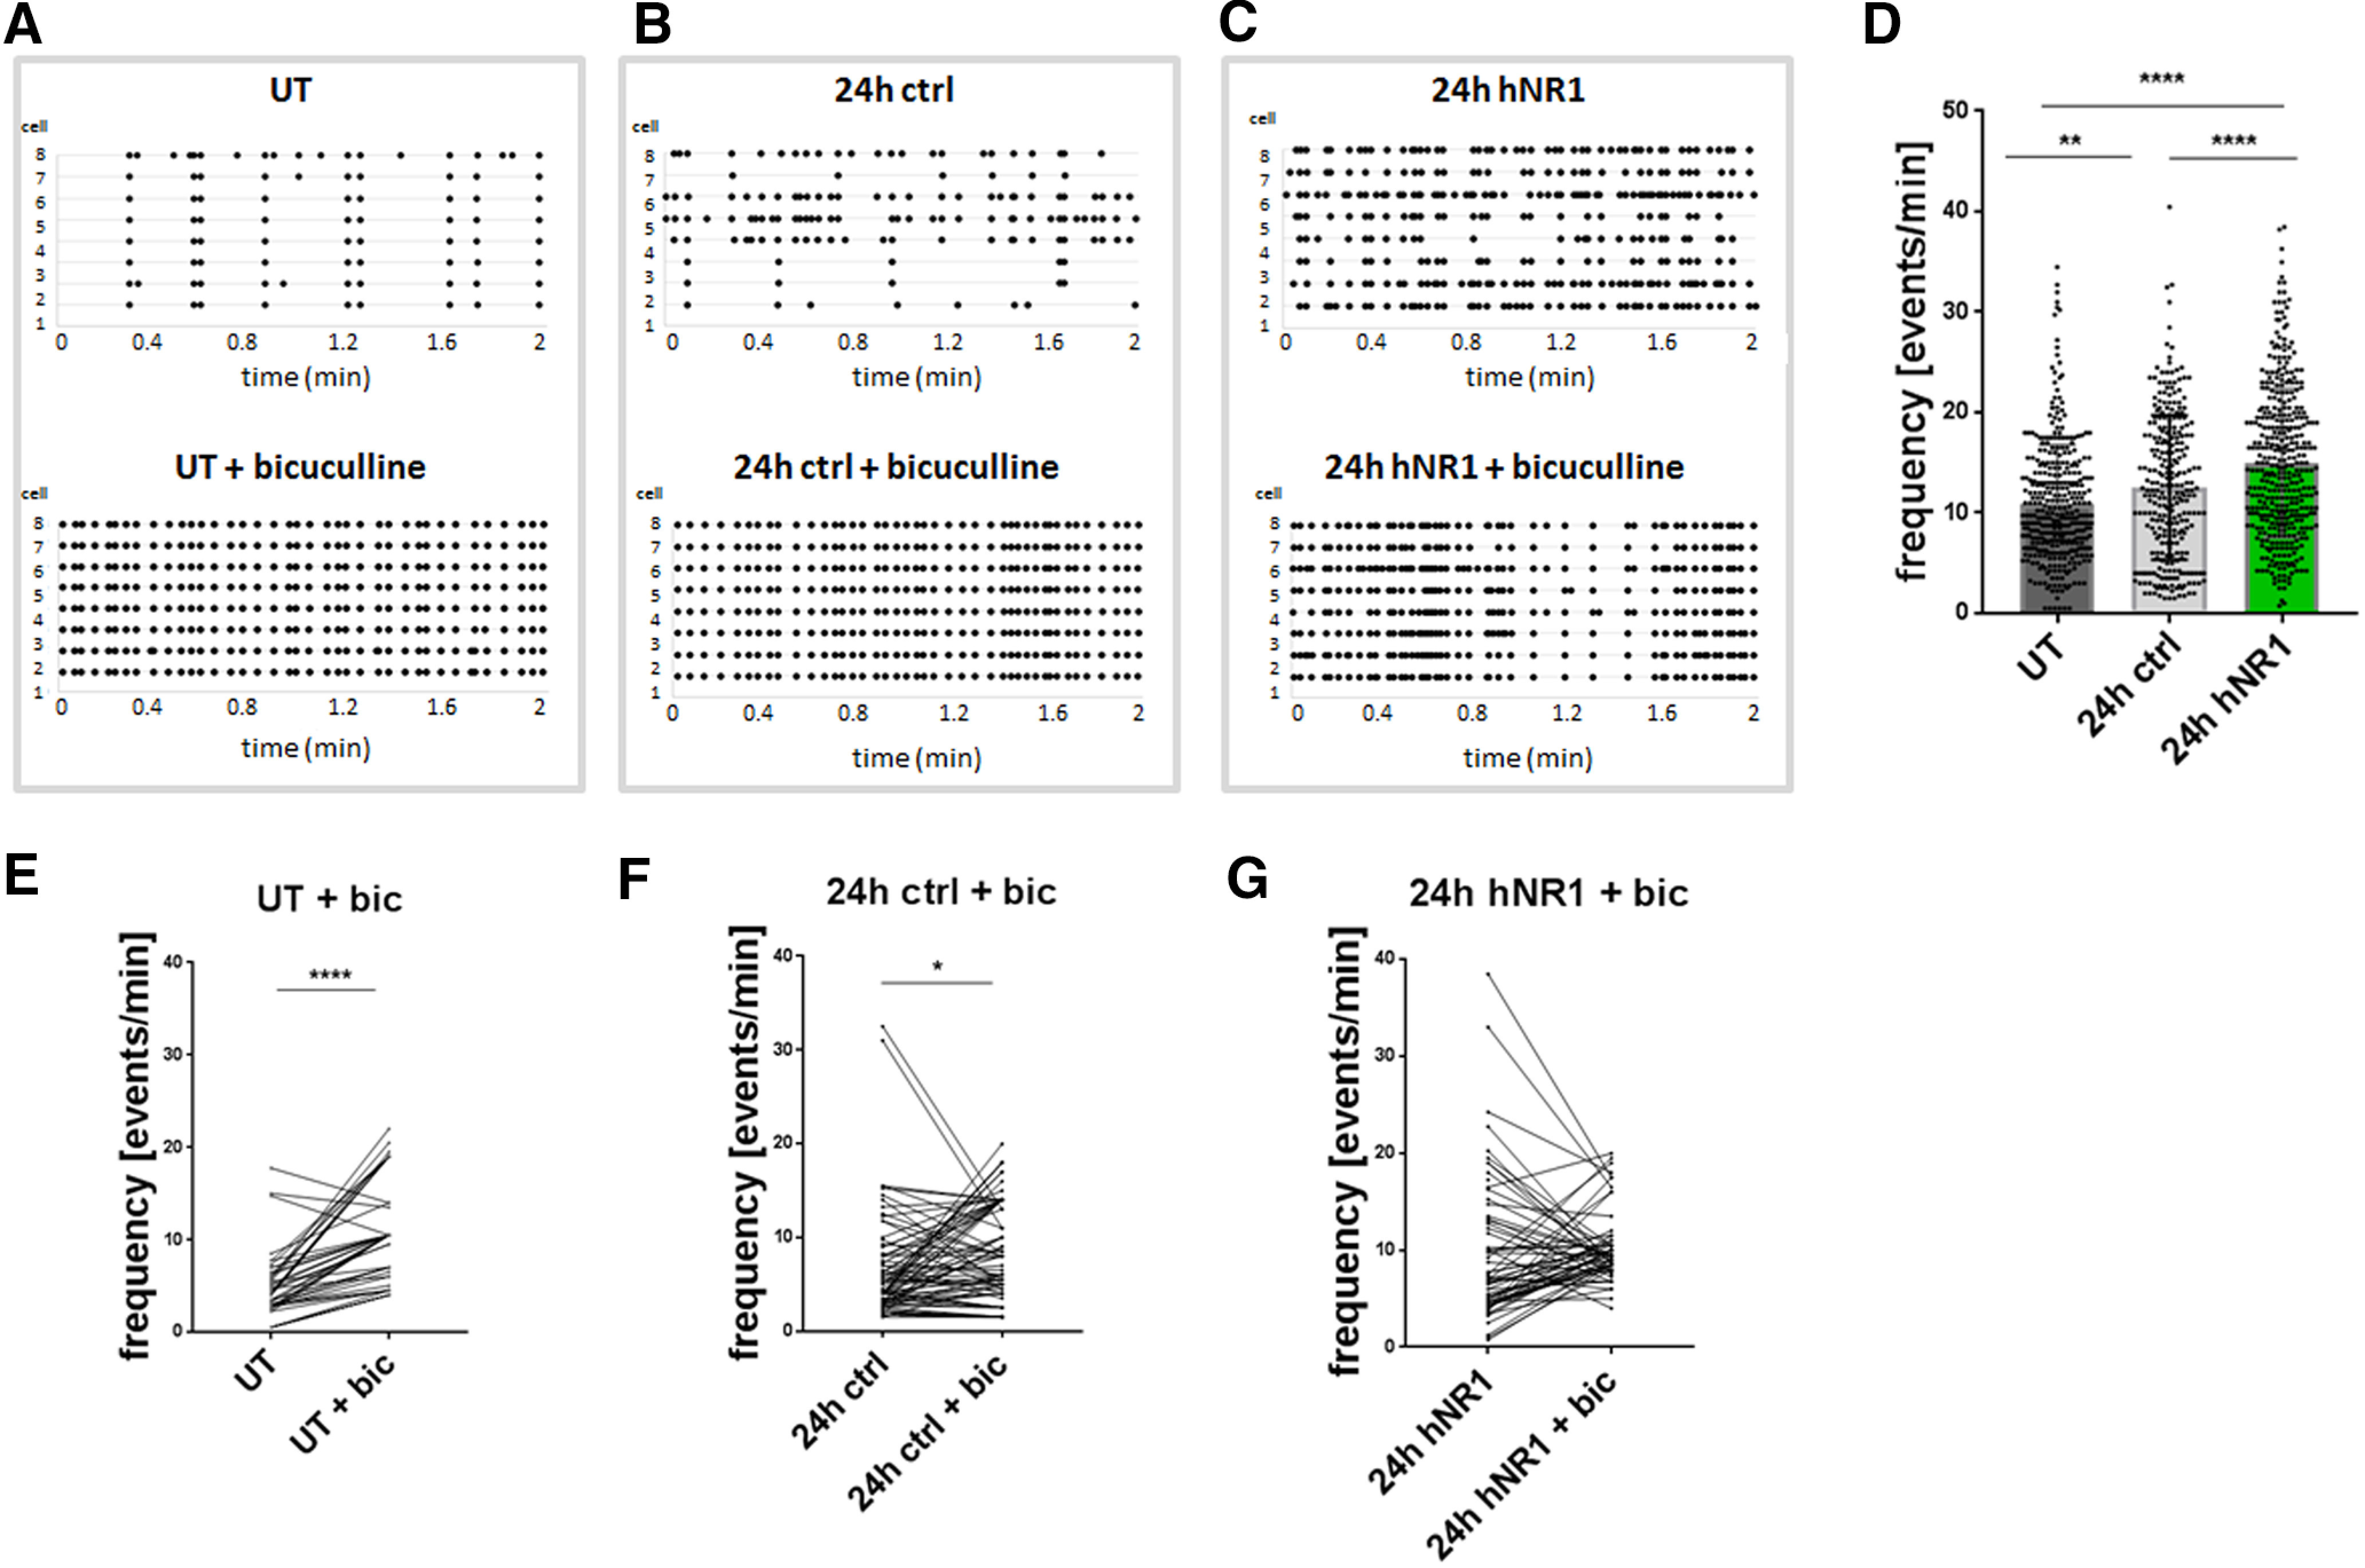
Calcium imaging reveals that networks treated with hNR1 antibody cannot be further disinhibited by bicuculline. A–C, Representative raster plots of calcium events recorded from neuronal somas (neuron ID on the y-axis) expressing RCaMP in untreated condition (UT) (A, upper panel), after 24 h of control antibody (B, upper panel) or 24 h of hNR1 antibody (C, upper panel) treatment. A–C, Lower panels: representative raster plots of calcium events of the same neurons as in upper panels following addition of bicuculline (bic, 30 μm) at the end of respective treatment. D, Frequency of somatic calcium events in untreated condition, after 24 h of hNR1 or control antibodies treatment (A–C, upper panels); UT = 10.89 ± 0.31, n = 366 cells, ctrl = 12.55 ± 0.43, n = 277 cells, hNR1 = 14.99 ± 0.37, n = 391 cells, 6 independent experiments, **p = 0.007, ****p < 0.0001. E–G, Within-cell comparison of the frequency of calcium events in the same cells at the end of 24-h treatment and after addition of bicuculline, tested by paired t test from three independent experiments, reveals that bicuculline disinhibits the networks in untreated condition (D) and after control antibodies treatment (E) but not after hNR1 (F) treatment. Quantification of calcium events: (E) UT = 4.83 ± 0,51, UT + Bic = 10.87 ± 0,81, mean of difference = 6.05 ± 0.75, n = 47 neurons, p < 0.0001; (F) 24 h ctrl = 6.84 ± 0.0.74, 24 h ctrl + Bic = 8.61 ± 0,59, mean of difference = 1.76 ± 0.82, n = 80 neurons, p = 0.035; (G) 24-h hNR1 = 9.88 ± 0.88, 24-h hNR1 + Bic = 10.24 ± 0.45, mean of difference = 0.57 ± 0.9, n = 62 neurons, p = 0.53. Error bars indicate SEM. ANOVA Tukey's multiple comparison test (D) and paired t test (E–G) were used to evaluate statistical significance. *p < 0.05, **p < 0.01, ****p < 0.0001.
