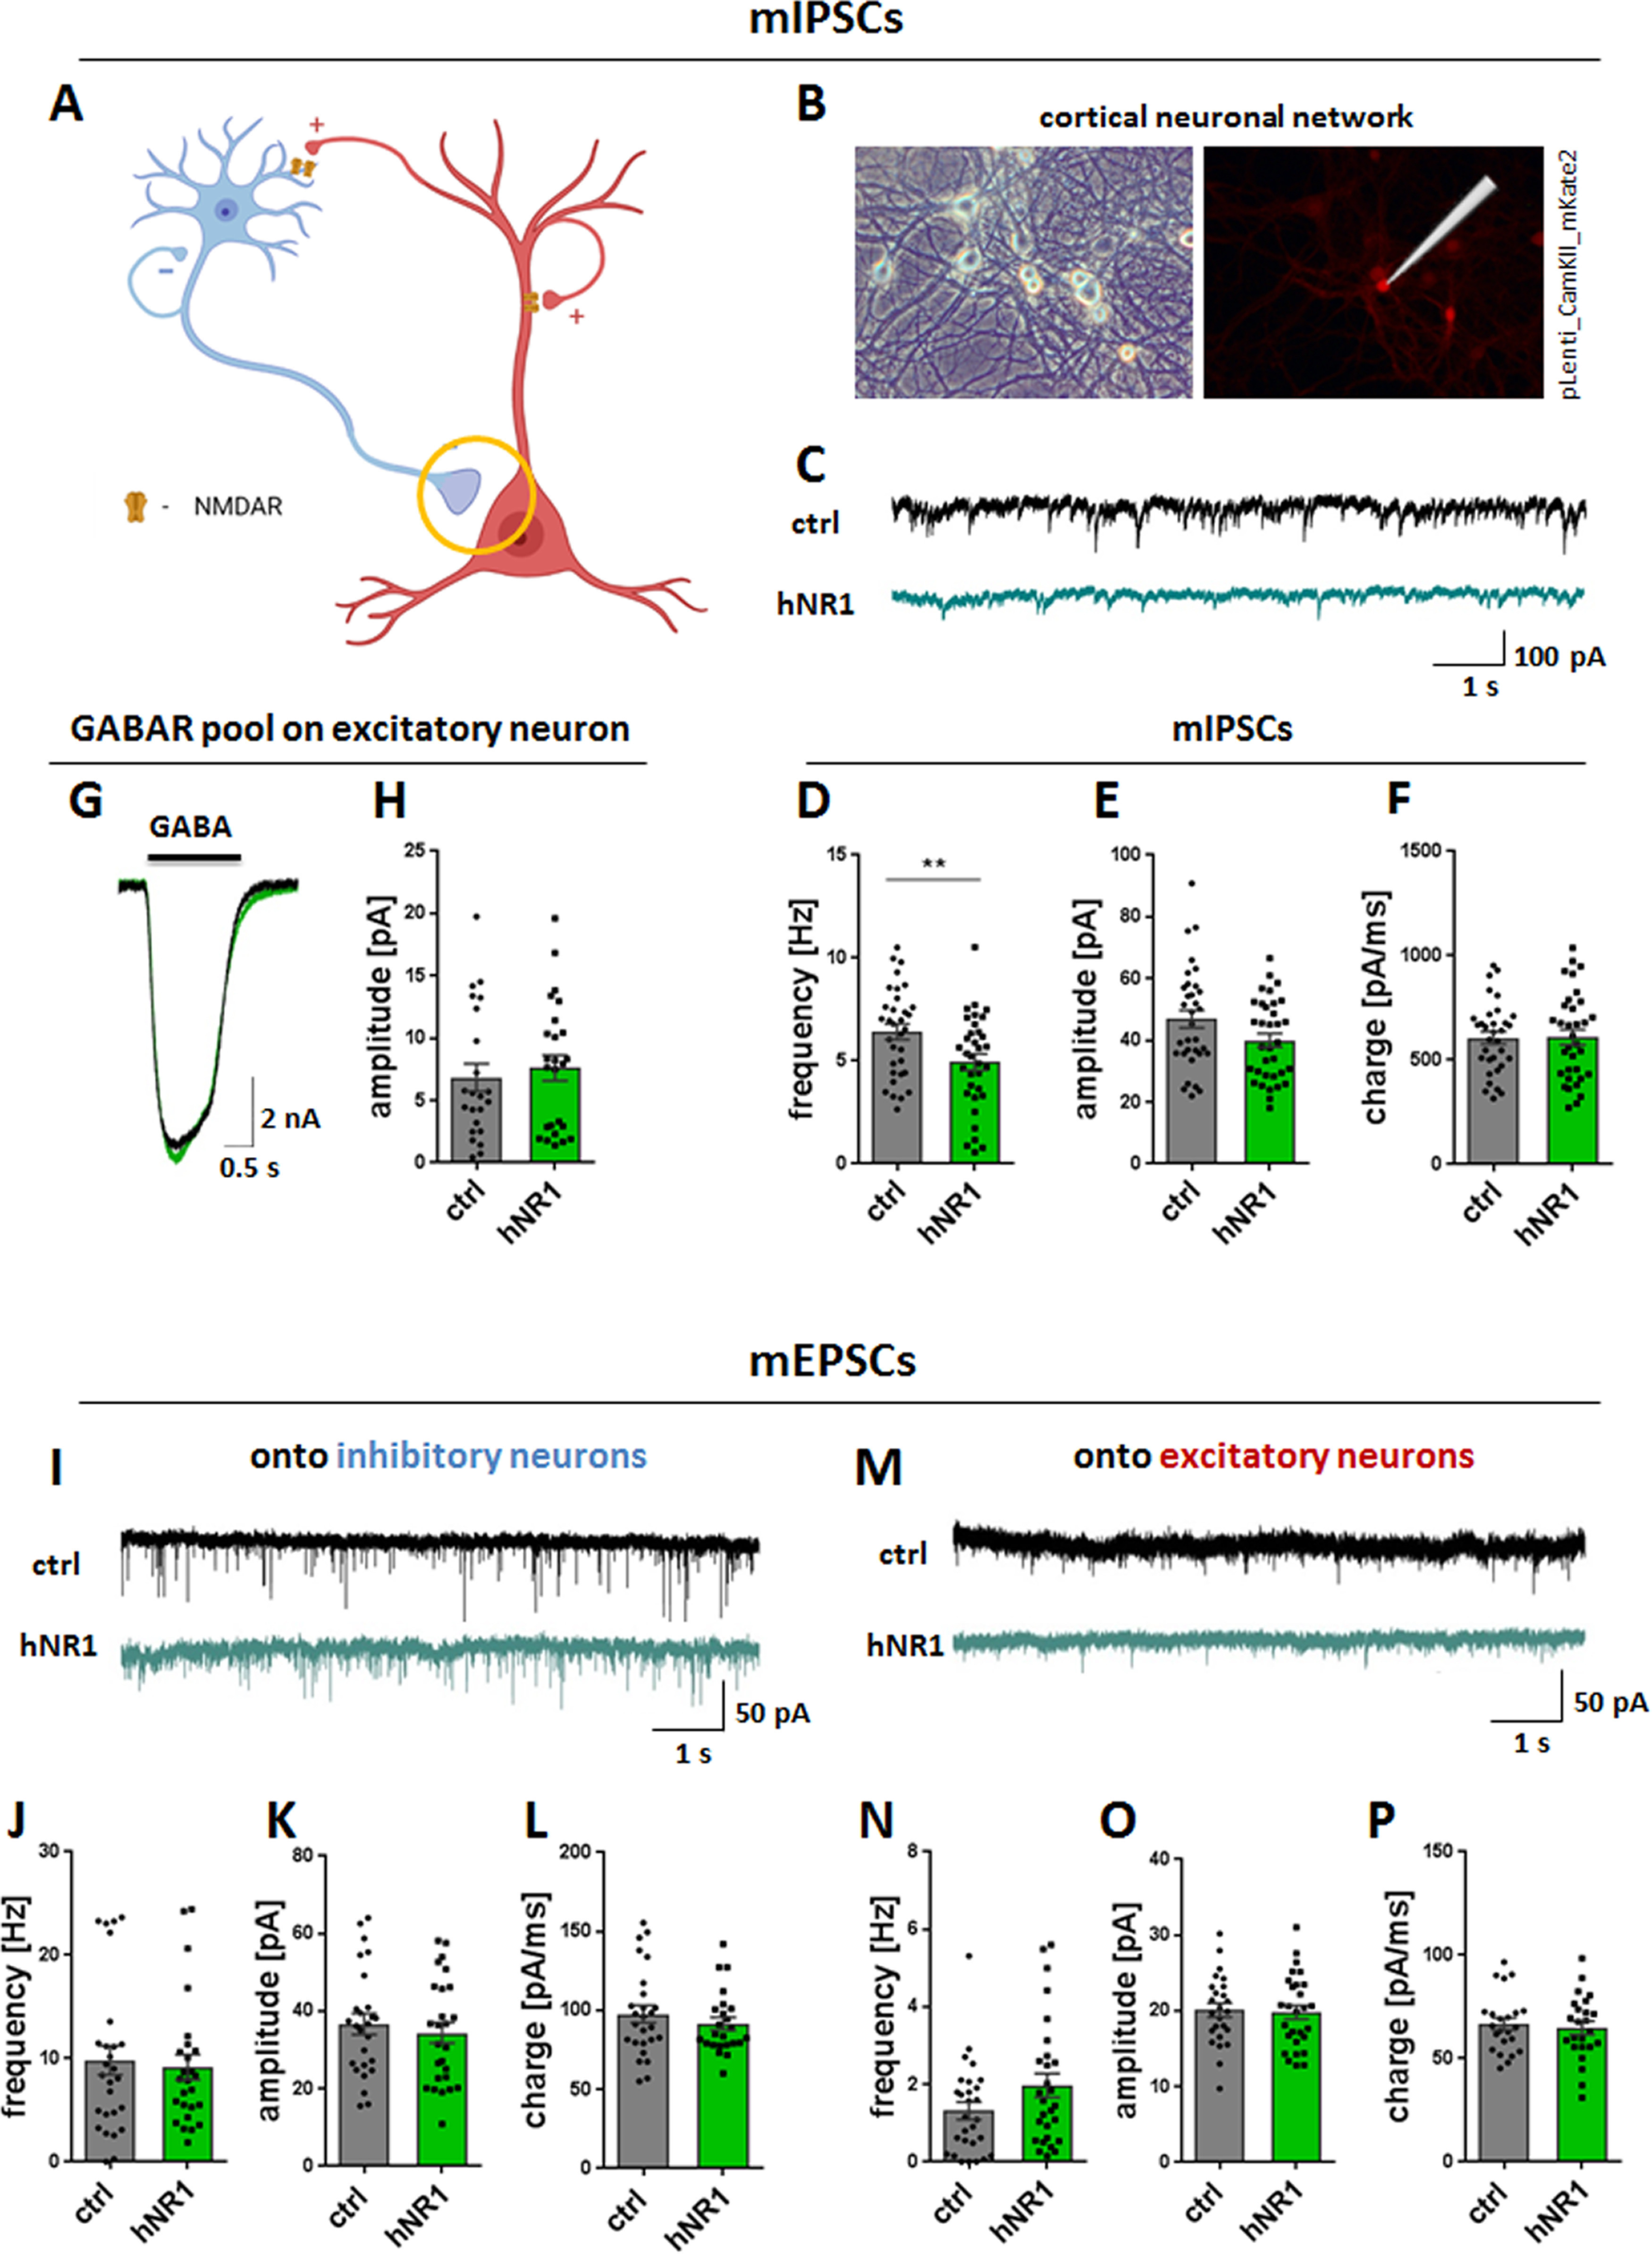
Figure 4.

hNR1 antibody decreases inhibitory drive onto excitatory neurons in cortical circuits but does not affect excitatory drive. A–H, Inhibitory drive onto excitatory neurons was measured by mIPSCs recorded from excitatory neurons in cortical neuronal networks. A, Schematic model of a simplified neuronal network composed of excitatory pyramidal neurons (red) and inhibitory neurons (blue), forming different types of synapses onto each other. Inhibitory synapse onto excitatory neuron is marked with a circle as a synapse of interest measured in this experiment. B, mIPSCs were recorded from excitatory neurons identified by expression of mKate2 expressed under excitatory neuron CamKII promoter. Left panel, BF image of representative cortical neuronal network. Right panel, Excitatory neuron identified by mKate2 fluorescent signal. C, Representative traces of mIPSCs recorded in a whole-cell patch-clamp configuration from excitatory neurons after 24 h of treatment with control (ctrl, upper panel) or hNR1 (lower panel) antibodies. Treatment with hNR1 antibody decreases frequency of mIPSCs onto excitatory neurons (D) and has tendency to decrease their amplitude (E), without affecting their charge (F). D–F, Quantification of mIPSCs parameters from three independent experiments, ctrl n = 33 neurons, hNR1 n = 34 neurons: (D) mIPSCs frequency: ctrl = 6.42 ± 0.37, hNR1 = 4.94 ± 0.4, p = 0.009; (E) mIPSCs amplitude: ctrl = 46.89 ± 2.89, hNR1 = 40.01 ± 2.25, p = 0.06; (F) mIPSCs charge: ctrl = 606.5 ± 29.72, hNR1 = 610 ± 36.37. G, H, hNR1 antibody treatment does not affect levels of GABA receptors on the postsynaptic excitatory neurons from which mIPSCs were recorded. G, Representative traces of GABA currents recorded from excitatory neurons, evoked by 1-s pulse application of 5 μm GABA. H, Quantification of GABA current amplitude presented in (F): ctrl = 6.84 ± 1.1, n = 23 neurons, hNR1 = 7.6 ± 1.04, n = 7.6 ± 1.04, n = 25 neurons. I–P, hNR1 antibody does not affect excitatory miniature transmission (mEPSCs) onto neither inhibitory (I–L) nor excitatory (M–P) neurons. I, M, Representative traces of mEPSCs recorded from inhibitory (I) or excitatory (M) neurons. Quantification of mEPSCs parameters from three independent experiments: (J) mEPSCs frequency: ctrl = 9.83 ± 1.41, n = 27 neurons, hNR1 = 9.17 ± 1.2, n = 26 neurons; (K) mEPSCs amplitude: ctrl = 36.7 ± 2.71, n = 26 neurons, hNR1 = 34.41 ± 2.68, n = 26 neurons; (L) mEPSCs charge: 97.83 ± 5.47, n = 26 neurons, hNR1 = 91.52 ± 4.02, n = 24 neurons; (N) mEPSCs frequency: ctrl = 1.32 ± 0.23, n = 28 neurons, hNR1 = 1.98 ± 0.21, n = 28 neurons; (O) mEPSCs amplitude: ctrl = 20.09 ± 0.93, n = 25 neurons, hNR1 = 19.84 ± 0.92, n = 28 neurons; (P) mEPSCs charge: ctrl = 66.76 ± 2.96, n = 23 neurons, hNR1 = 64.86 ± 3.22, n = 24 neurons). Error bars indicate SEM. Unpaired t test was used to evaluate statistical significance. **p < 0.01.
