Figure 7.

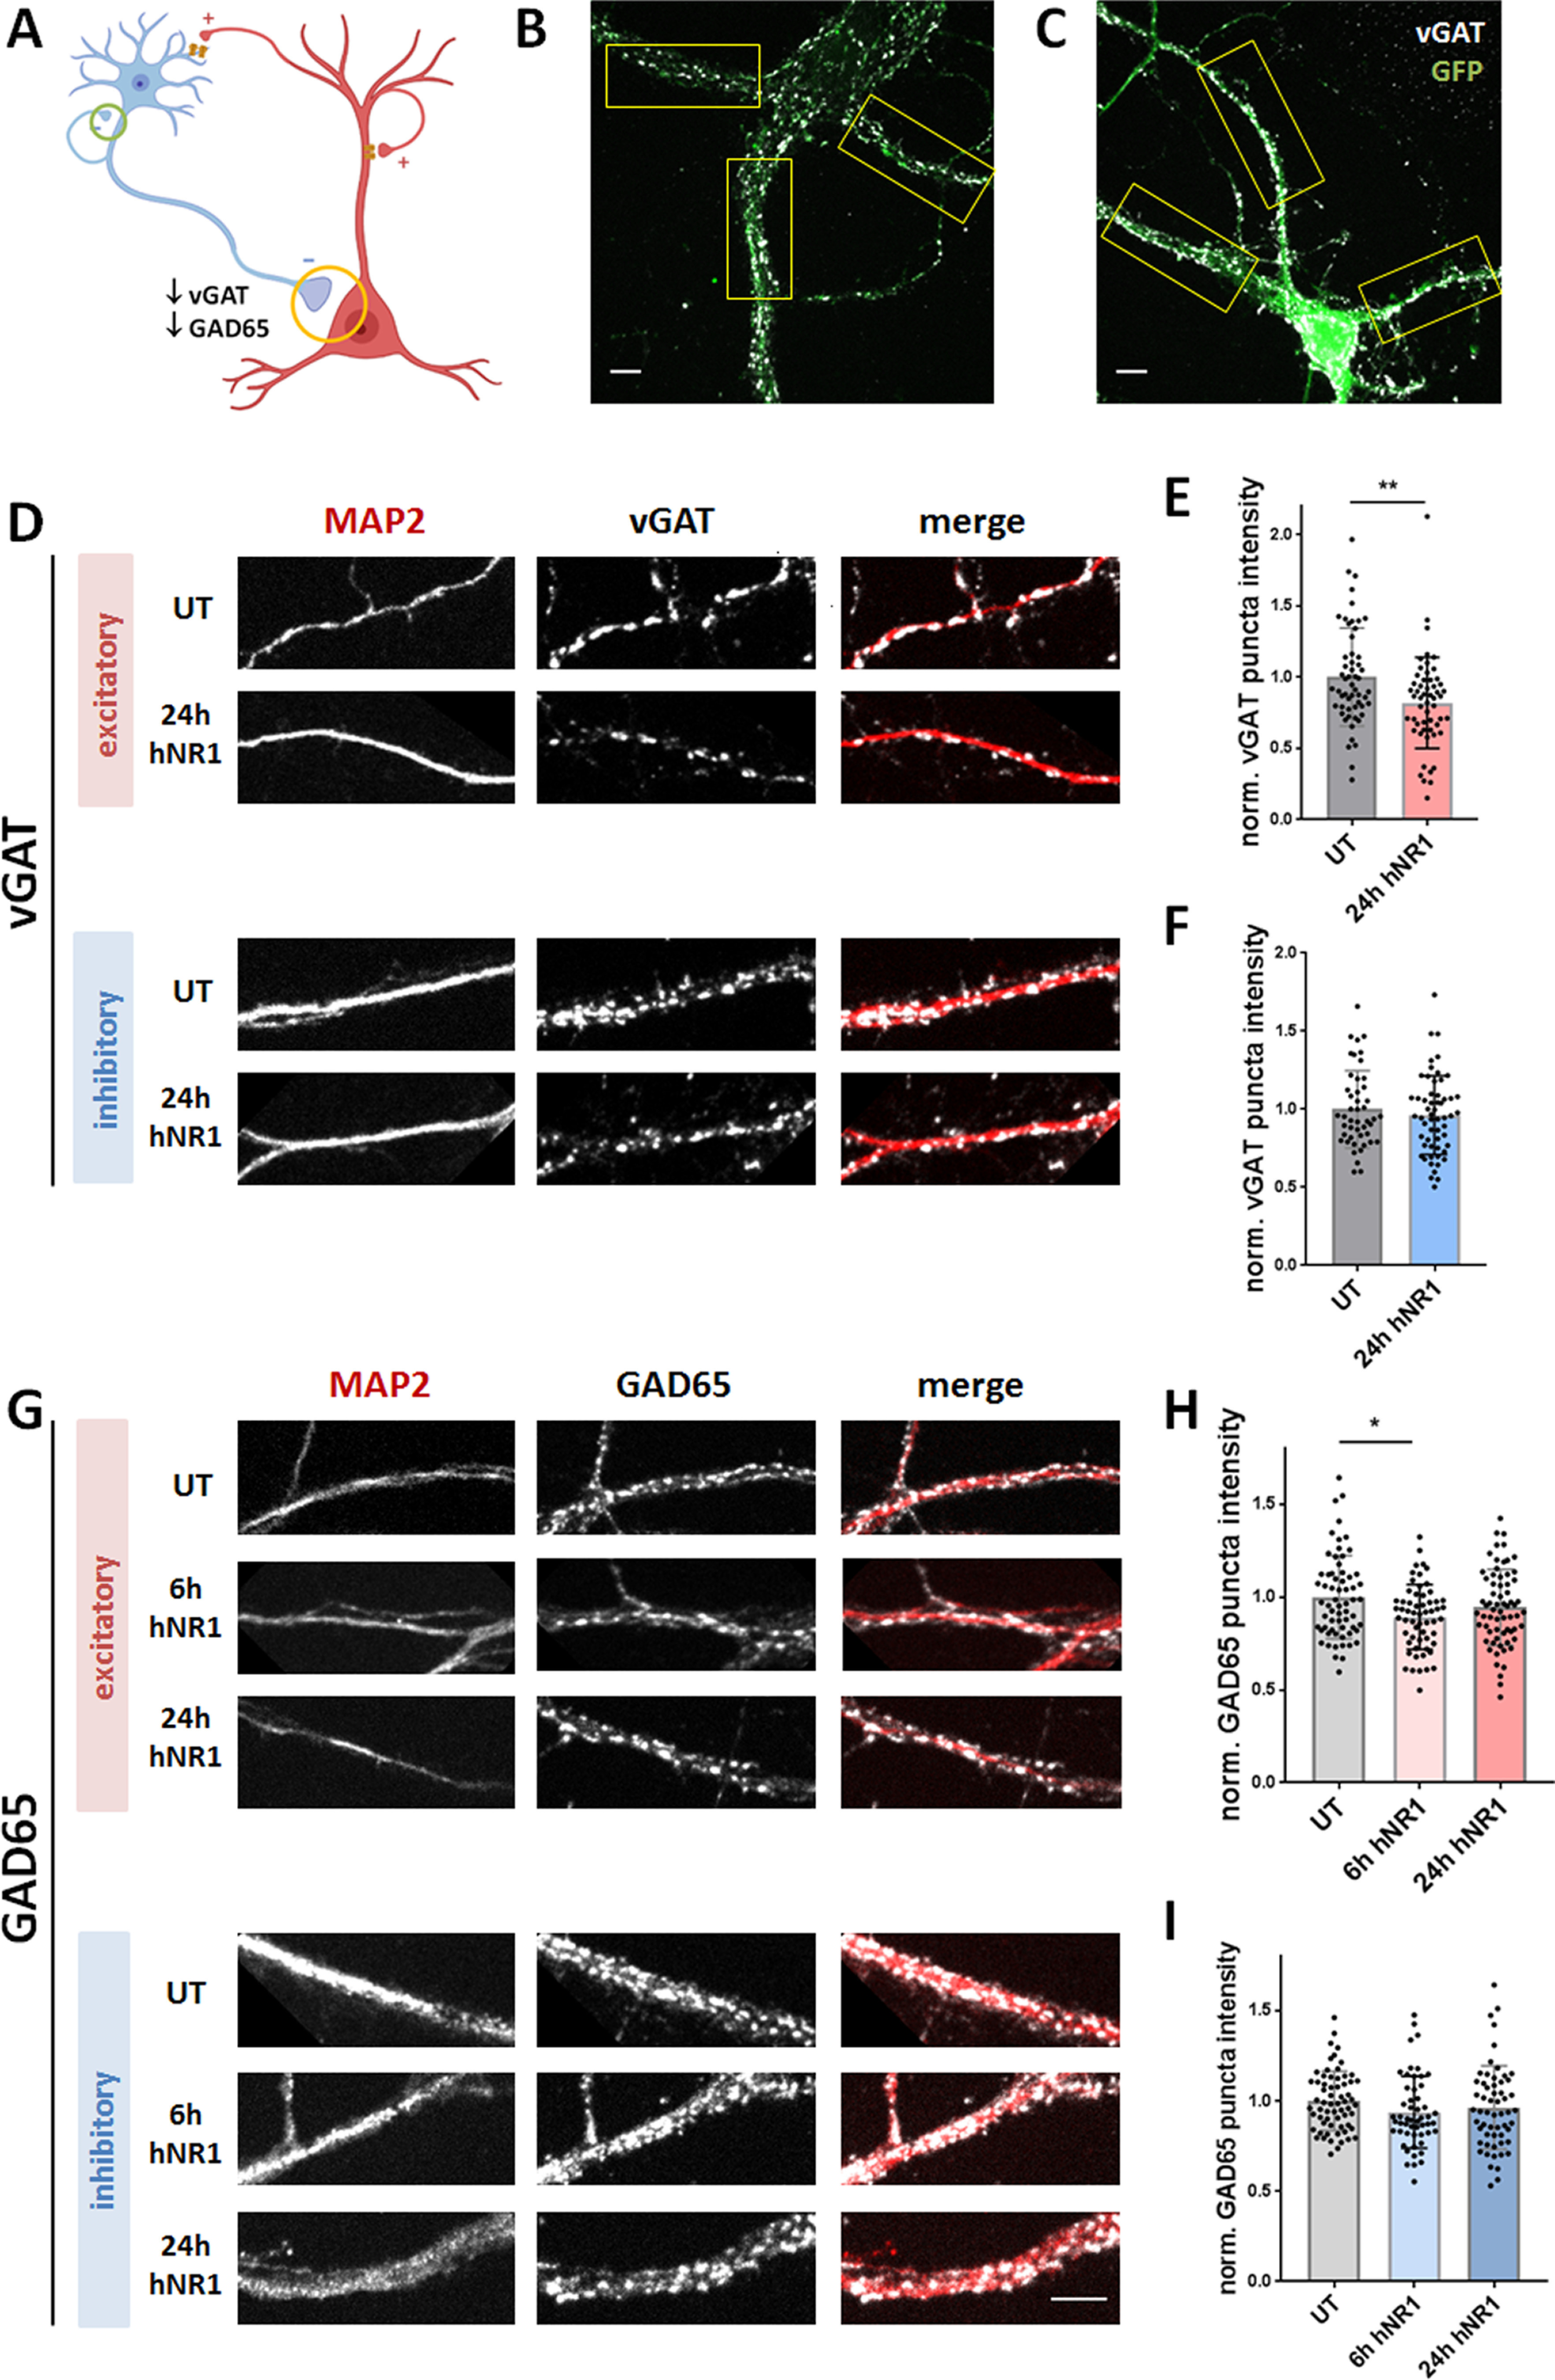
hNR1 antibody decreases levels of inhibitory presynaptic proteins VGAT and GAD65 in inhibitory-to-excitatory neuron synapses. A, Schematic model showing investigated inhibitory synapses and summarizing the finding: decreased levels of GAD65 and VGAT at inhibitory synapses onto excitatory (yellow circle), but not inhibitory (green circle), neurons. B, C, Representative images of cortical excitatory (B) and inhibitory (C) neurons identified by staining with antibodies against GFP. Only proximal dendrites close to soma, which are easily identified as GFP-positive or GFP-negative, were chosen for ROI selection (boxes). D, G, Images of ROIs of cortical excitatory and inhibitory neurons which were fixed and stained with antibodies against GFP, MAP2, and either VGAT (D) or GAD65 (G), in untreated condition (UT) or after 6 or 24 h of hNR1 antibodies treatment. E, F, Normalized intensity of VGAT puncta along dendrites from three independent experiments: (E) on excitatory neurons: UT = 1 ± 0.05, n = 56 ROIs, 24-h hNR1 = 0.82 ± 0.04, n = 55 ROIs, p = 0.005; (F) on inhibitory neurons: UT = 1 ± 0.04, n = 47 ROIs, 24-h hNR1 = 0.96 ± 0.03, n = 57 ROIs. H, I, Normalized intensity of GAD65 puncta along dendrites from three independent experiments: (H) on excitatory neurons: UT = 1 ± 0.03, n = 64 ROIs, 6-h hNR1 = 0.89 ± 0.02, n = 59 ROIs, 24-h hNR1 = 0.95 ± 0.02, n = 67 ROIs, p = 0.01; (I) on inhibitory neurons: UT = 1 ± 0.02, n = 64 ROIs, 6-h hNR1 = 0.94 ± 0.03, n = 53 ROIs, 24-h hNR1 = 0.96 ± 0.03, n = 58 ROIs. Error bars indicate SEM. Scale bar: 10 µm. Paired t test (E, F) and ANOVA Tukey's multiple comparison test (H, I) were used to evaluate statistical significance. *p < 0.05, **p < 0.01.
