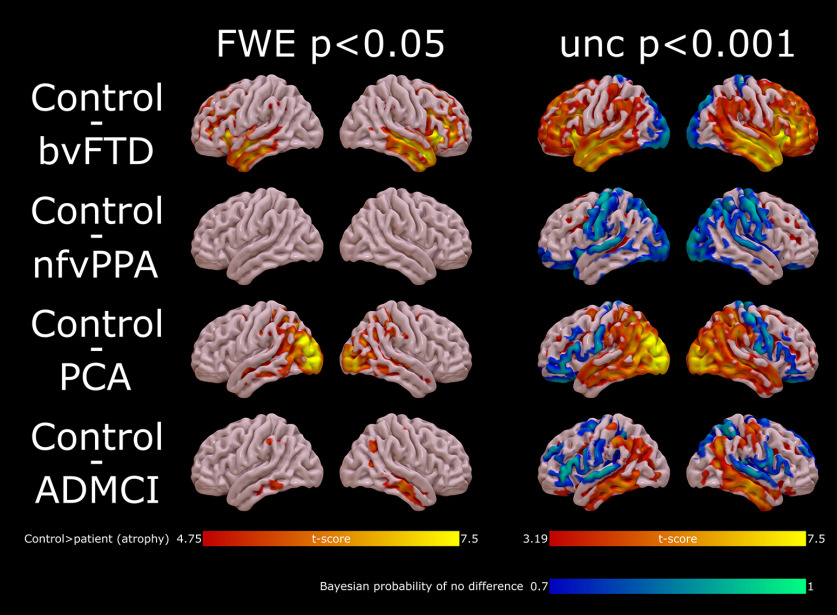
Figure 2.
Distribution of gray matter atrophy in the patient participants. Random field theory t-maps for atrophy assessed with a classical statistical parametric mapping approach is shown in “hot” colors, REML thresholded at voxelwise FWE p < 0.05 (left) and uncorrected p < 0.001 (right). On the right-hand maps, Bayesian maps for posterior probability of no atrophy (the “null”) are also shown in “cool” colors, thresholded for illustration at 0.7. bvFTD, behavioral variant fronto-temporal dementia; nfvPPA, nonfluent variant primary progressive aphasia; PCA, posterior cortical atrophy; ADMCI, Alzheimer's disease mild cognitive impairment with positive amyloid imaging.

