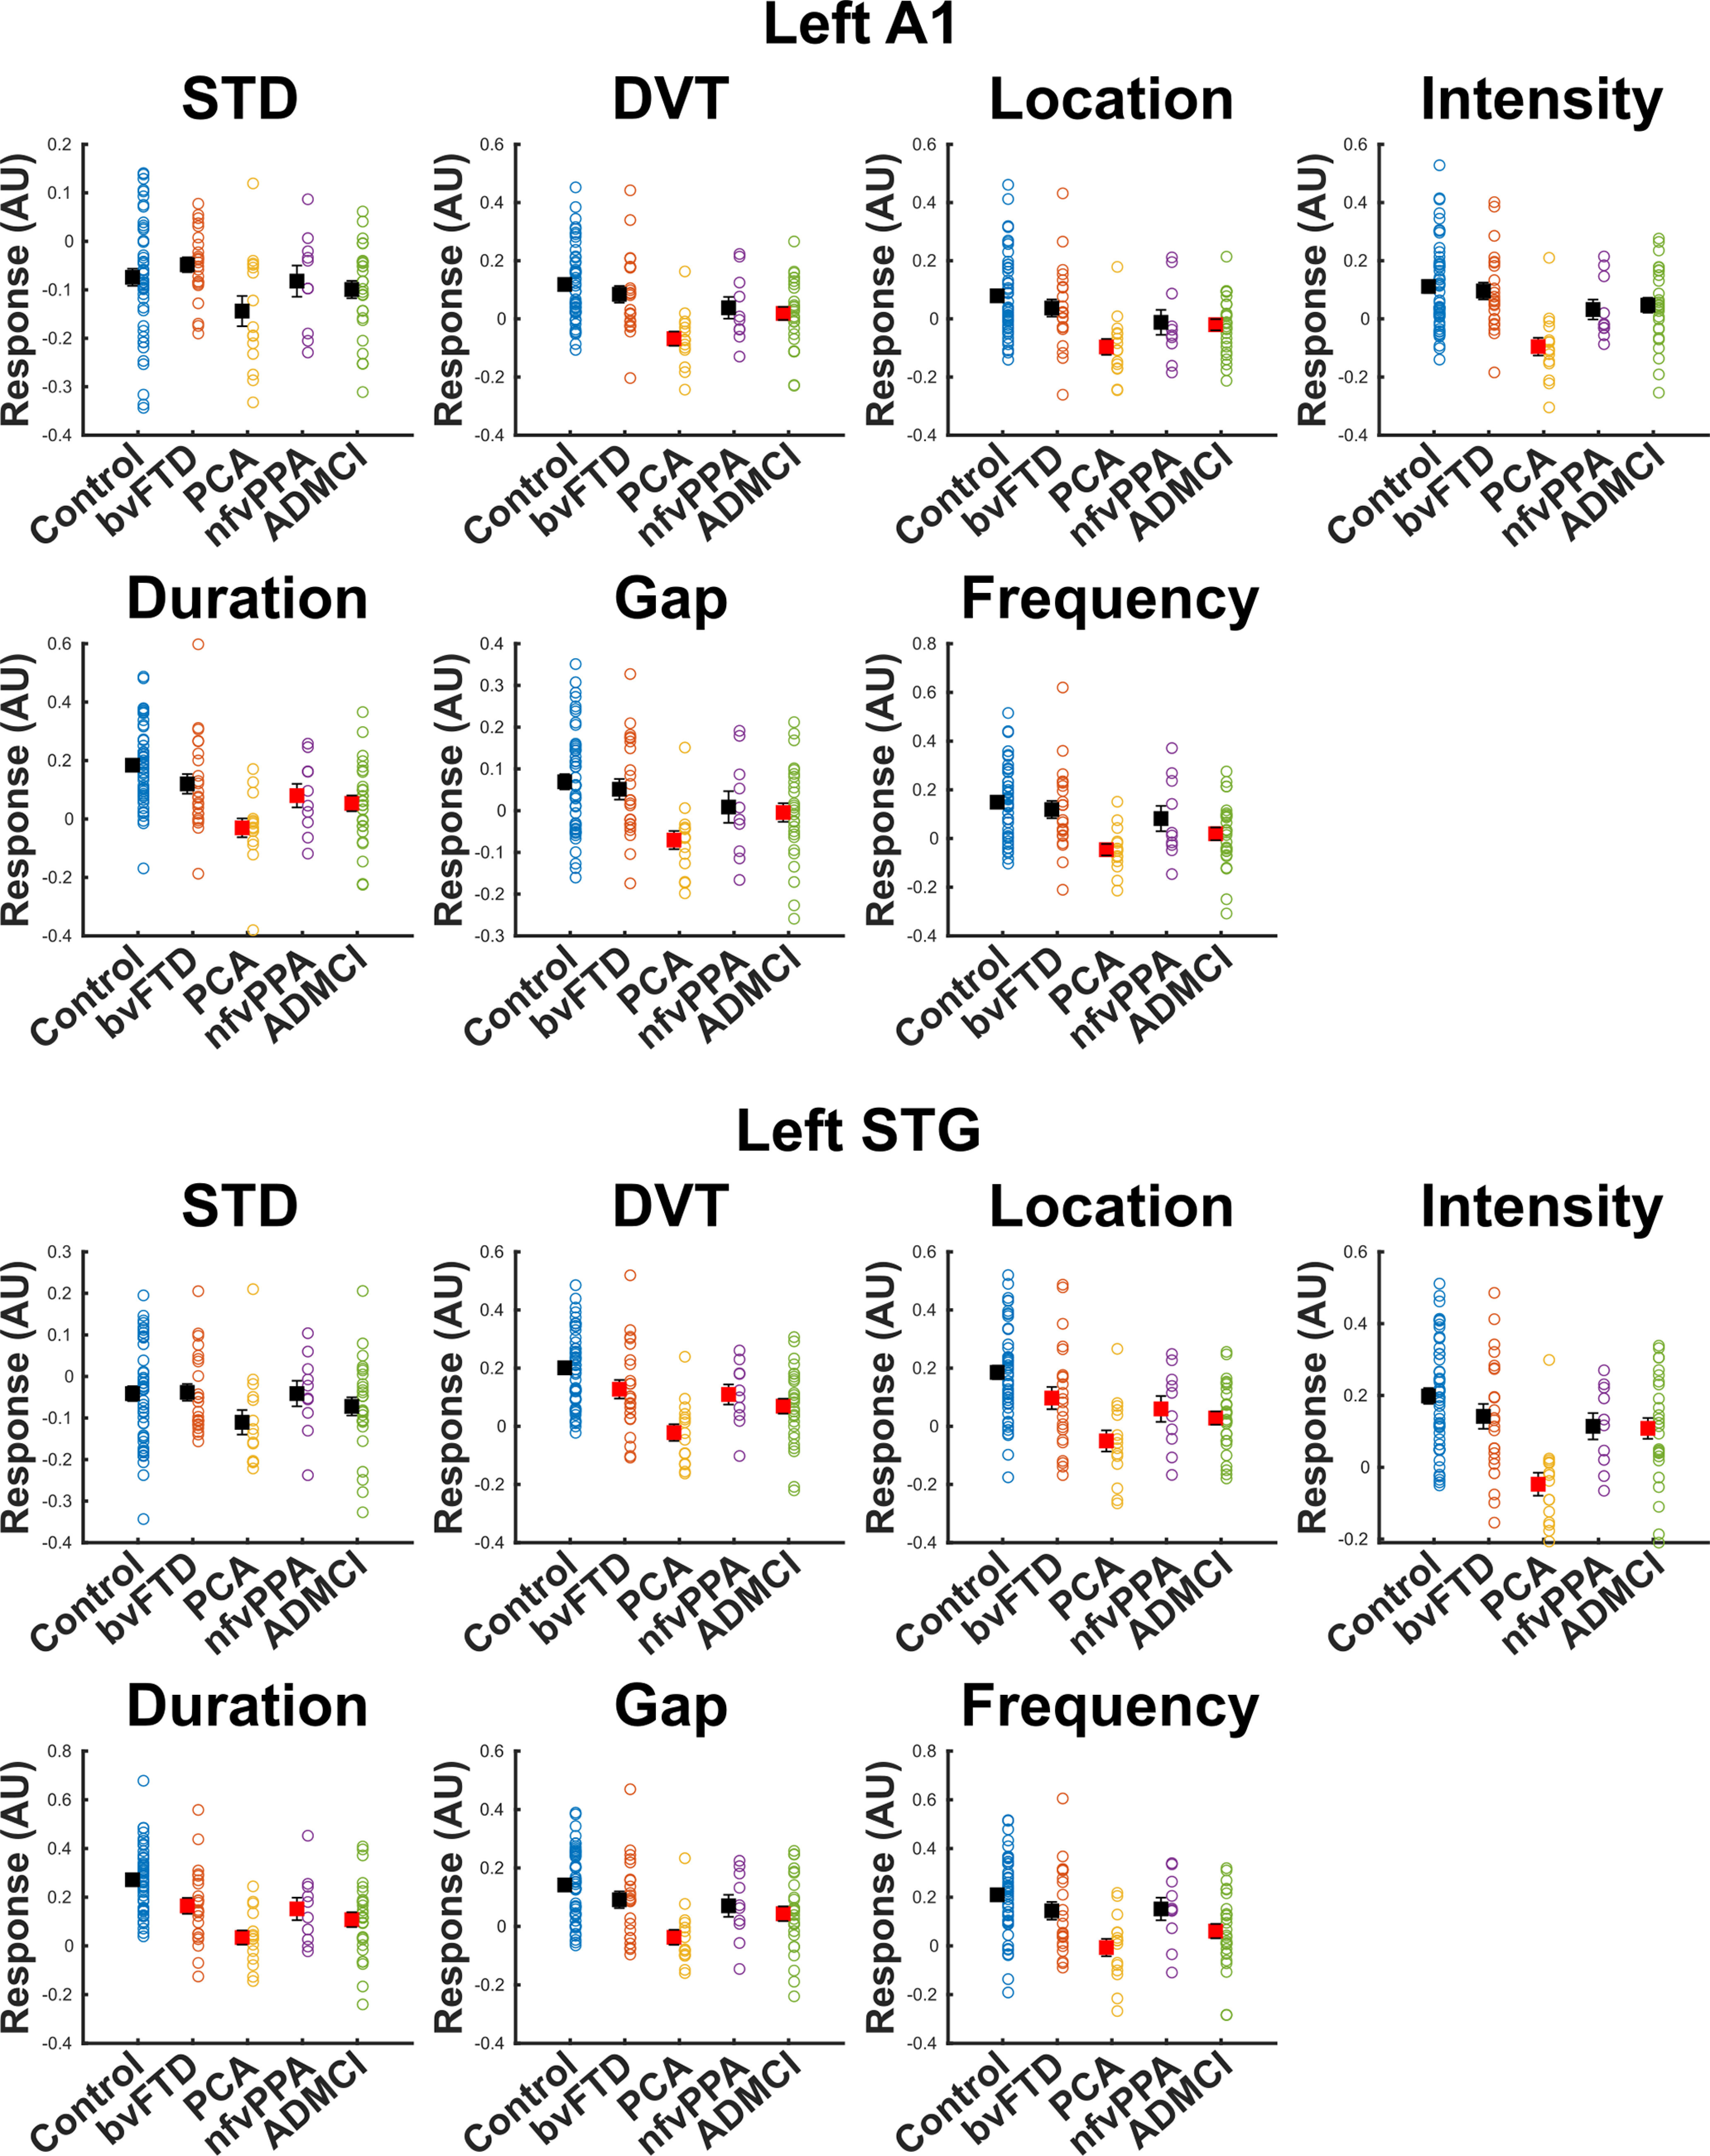
Figure 5.

Our literature prespecified approach was to quantify MMN amplitude in left A1 (Hughes et al., 2013) by averaging amplitude from 100 to 200 ms. Individual datapoints are shown, as well as the mean its standard error. To gain insight into whether the differences we demonstrate are primarily driven by adaptation to environmental regularity or response to novel stimuli, we repeated the same procedure with the standard (STD) and combined deviant (DVT) response, as well as for each oddball type individually, and assessed group differences with ANOVA. In left A1, there was no main effect of diagnosis on STD response in the 100- to 200-ms time window (p = 0.089). There was a main effect of diagnosis on DVT amplitude (p = 1.73 × 10⁻⁵). Post hoc tests demonstrated that patients with PCA and ADMCI had significantly lower amplitudes than controls (illustrated in red), but bvFTD and nfvPPA did not significantly differ from controls. This pattern was broadly the same across deviant types individually, with small changes in pattern resulting in nfvPPA differing from controls in duration deviants and ADMCI not differing in intensity deviants. The data in left STG had slightly better SNR than A1, because of its closer proximity to the scalp. Here, there was still no main effect of diagnosis for STD amplitude (p = 0.245). For DVT, there was a main effect of diagnosis (p = 6.28 × 10⁻⁷), and here, we were able to detect a group difference in response amplitude for every group individually versus controls in post hoc tests. However, it is important to note that left STG was not our literature specified location of interest for MMN quantification, and is included here only as data illustration, not the basis of any strong claims in the manuscript.
